
Investors aiming to benefit from large price increases often use a method that joins solid basic business qualities with good market timing. One such tactic is to search for stocks showing solid growth traits, such as increasing earnings and revenue, while also presenting good financial condition and earnings. This basic power offers a firm base. The method then adds price chart study, searching for particular patterns that indicate a stock is pausing its gains and getting ready for a possible rise to new peaks. This pairing seeks to find firms that are both basically sound and are starting a period where market force could increase their upward path.
Mueller Industries Inc (NYSE:MLI) recently appeared from a search made to locate this kind of chance. The Tennessee-based maker of copper, brass, aluminum, and plastic goods seems to be advancing from a time of outstanding operational results, with its stock chart now indicating a new stage upward.
A Base of Basic Power
Before studying the chart, it is important to know the basic engine moving Mueller Industries. The firm's latest basic study report shows a highly effective and financially sound operation. For a growth-centered method, the nature of the growth and the firm's capacity to maintain it are key.
-
Outstanding Earnings and Condition: MLI gets a nearly full 9 out of 10 for Earnings and a full 10 for Financial Condition. Important measures are notable:
- Return on Invested Capital (ROIC): At 20.73%, MLI's ROIC is better than 95% of similar firms in the Machinery field, showing excellent capital use.
- Earnings Margins: With an Operating Margin of 21.48% and an Earnings Margin of 18.10%, the firm places in the top 7-8% of its field.
- Very Firm Balance Sheet: The firm has no debt, has a very high Altman-Z score of 18.52, and has current and quick ratios that show enough cash to meet needs and fund growth.
-
Shown and Expected Growth: MLI receives a Growth score of 7, backed by solid past results and good future outlook.
- Past Growth: Over the last year, Earnings Per Share (EPS) increased by 24.9%, while the 3-year yearly EPS increase rate is a notable 42.6%. Sales have also grown at a good rate.
- Future Growth: Experts think this motion will continue, with future EPS growth estimated at 12.67% each year.
This basic picture is vital for the method. Strong earnings and a very firm balance sheet (Condition) give stability, while steady growth in profits and sales (Growth) is the main force an investor is counting on. It indicates the firm's recent achievement is not luck but the outcome of operational skill.
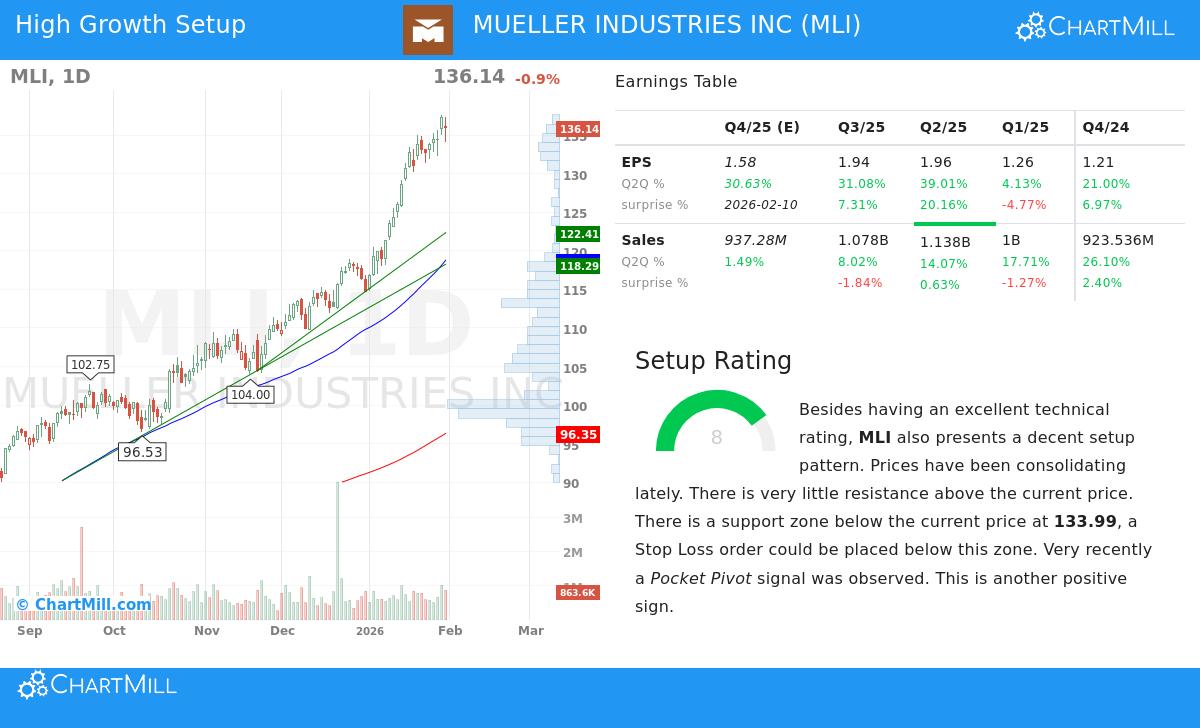
The Price Chart Position for a Possible Rise
While basics explain the "why," price chart study can help with the "when." MLI's price chart study report shows a stock that is strong in price terms and may be tightening for more progress.
- Forceful Upward Path: Both the near-term and long-term paths for MLI are scored as good. The stock is trading above all its main average lines (20, 50, 100, and 200-day SMAs), which are all pointing up, a clear sign of continued positive motion.
- Pause Near Peaks: After a large advance over the past year, MLI has been trading in a set band over the past month. This kind of pause after a strong move is often a good stop, letting the stock build force for its next directional step.
- Rise Sign: The price chart report notes a recent "Pocket Pivot" sign, a volume-based pattern that often shows gathering by big investors during a pause stage. With almost no price barriers above noted and the stock staying near its 52-week peak, the position indicates a rise above the recent band could start a new wave of buying.
This price chart view fits the growth investing method's second part. The strong upward path confirms the market is valuing the basic story. The current pause and high-level position give a possible entry point, as a rise would signal that the time of stop is finished and the next stage of the growth path may be starting.
Price Assessment and Points
Despite its strong advance, MLI's price assessment stays a mixed view, scoring a 6. Its P/E ratio of 21.37 is above the field middle but below the wider S&P 500 average. More importantly, its low PEG ratio, which includes earnings growth, and its good Price-to-Free Cash Flow ratio indicate the market may not be fully valuing the firm's growth path and outstanding cash production. For a growth investor, paying a fair price for high-quality, increasing earnings is a key idea, and MLI's price assessment does not seem high relative to its outlook.
Final Points
Mueller Industries offers a strong example for a joined basic and price chart growth method. The firm has shown a capacity to grow earnings forcefully while keeping excellent financial condition and field-leading earnings. In price terms, the stock is in a confirmed upward path and is now pausing near its peaks, giving a possible position for a continuation of its positive move. This link, where a basically sound growth story gets confirmation from good price movement, is what investors using this approach actively look for.
Interested in finding other stocks that match this picture of solid growth joined with good price chart positions? You can study the set search Strong Growth Stocks with good Technical Setup Ratings to see more possible chances.
Note: This article is for information only and does not make financial guidance, a suggestion, or a deal to buy or sell any security. The study is based on data and reports given by other parties. Investing has risk, including the possible loss of original funds. You should do your own study and talk with a skilled financial guide before making any investment choices. Past results are not a guide for future results.