
Investors often face a challenge when trying to align a company's core business strength with a good time to enter a position. A strategy that uses both fundamental and technical analysis tries to solve this by finding stocks that are not only financially sound and expanding but are also showing positive price momentum and good chart patterns. This method aims to find chances where solid business fundamentals are being supported by market activity, possibly pointing to a continuation of the upward move.
One stock that recently came from this kind of combined screening process is MUELLER INDUSTRIES INC (NYSE:MLI). The company, a maker of copper, brass, aluminum, and plastic products, seems to be showing the traits of a solid growth stock while also presenting a good technical picture.
Fundamental Strength: The Base for Growth
The fundamental argument for MLI is strong, as shown in its detailed fundamental analysis report. The company gets an overall fundamental rating of 8 out of 10, with very high scores in two important areas: Financial Health and Profitability. This solid base is important for any growth-focused investment, as it shows the company has the steadiness to handle economic changes and put money back into its business.
- Very High Financial Health (Rating: 10/10): MLI’s balance sheet is a key strength. The company has no debt, which gives it great financial options and takes away risk from interest costs or refinancing. This is supported by good liquidity ratios, with a Current Ratio of 4.82, much higher than over 90% of similar companies in the Machinery industry.
- High Profitability (Rating: 9/10): The company is not just steady, it earns strong profits. Important measures like Return on Invested Capital (ROIC) of 20.73% and a Profit Margin of 18.10% put it in the top group of its industry. These margins show efficient operations and the ability to set prices, which are key for keeping expansion going.
- Proven and Expected Growth (Rating: 7/10): MLI has a good history of growth, with Earnings Per Share (EPS) expanding at an average rate of 42.60% over recent years. While future expansion is thought to slow, analysts still predict a solid 12.67% yearly EPS growth ahead. This mix of past success and a believable growth path is a main idea of growth investing.
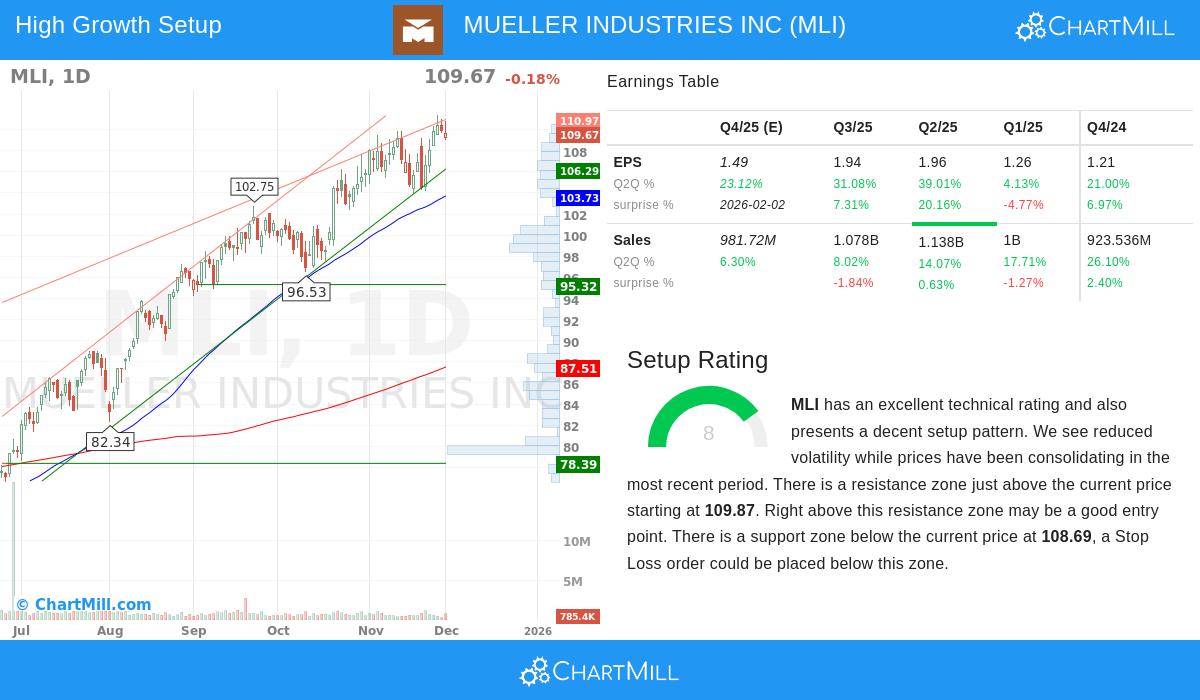
Technical Momentum: The Market's Show of Support
While solid fundamentals point to a good company, technical analysis helps measure market feeling and find possible entry points. MLI’s technical analysis report shows a pattern of continued positive momentum, getting a full technical rating of 10 out of 10.
- Positive Trends in Every Timeframe: Both the short-term and long-term trends for MLI are clearly positive. The stock is trading above its main moving averages (20, 50, 100, and 200-day), which are all rising. This agreement points to steady buying interest.
- Good Relative Performance: MLI is doing better than the wider market, showing stronger yearly performance than 88% of all stocks and beating 92% of its industry peers. This relative strength is an important signal for growth stocks, as it shows money is moving into the stock even with wider market situations.
- Trading in a Range Near Highs: The stock is now trading near its 52-week high, which is usually a positive sign. The technical report states that MLI has been trading in a range over the last month, which can set the stage for a possible next move higher. The situation is seen as acceptable, with a set resistance area just above the current price. A clear move above this area could be seen as a technical confirmation, supporting the core fundamental strength.
Why This Mix is Important
The screening strategy that found MLI is effective because it looks for agreement. A growth stock with bad financial health is risky, a technically positive stock with poor fundamentals may not last. By needing both, the strategy looks for companies where very good business results (high growth, profitability, and financial health) are being seen and supported by the market (positive trends, good relative performance, and constructive patterns). This double confirmation can help investors stay away from misleading opportunities and join trends with a higher chance of continuing.
For investors wanting to look at other stocks that meet this strict mix of solid growth fundamentals and positive technical situations, more results can be seen using the set "Strong Growth Stock Technical Setups" screen.
Disclaimer: This article is for information only and does not make up financial advice, an approval, or a suggestion to buy, sell, or hold any security. Investing has risk, including the possible loss of principal. The fundamental and technical data given are from sources thought to be dependable, but their correctness cannot be sure. Always do your own complete research and think about talking with a qualified financial advisor before making any investment choices.