
Investors aiming to benefit from large market shifts frequently search for a combination of solid core business progress and positive price movement. One way to find these chances is by looking for stocks that show strong basic growth traits while also displaying a favorable chart arrangement. This method tries to join the long-term potential of a company's financial path with the nearer-term timing cues offered by price history, possibly identifying stocks ready to advance from a period of sideways movement.
MercadoLibre Inc (NASDAQ:MELI) functions as a leading e-commerce and fintech network in 18 Latin American nations. Its combined system includes a marketplace, payments service (Mercado Pago), credit offerings, shipping, and advertising, placing it centrally in the area's digital change.
Basic Growth Driver
The center of this search plan is finding companies with superior and lasting growth, a main force for future stock price gains. MercadoLibre’s basic report confirms its position as a leading growth stock. The company gets a top Growth Rating of 9 out of 10 from ChartMill, putting it in the highest group of its sector.
- Strong Past Growth: In recent years, MercadoLibre has shown notable enlargement.
- Revenue has increased at an average yearly speed of 55.35%.
- Earnings Per Share (EPS) has risen by an average of 172.65% each year.
- Good Forward Progress: This growth is not only in the past. Experts predict continued solid enlargement.
- Future EPS is estimated to increase by 31.97% on average.
- Revenue is expected to grow by 24.56% per year.
This exceptional growth is backed by very good earnings and money strength, both scoring 8 out of 10. The company has high returns on equity and invested capital, getting better earnings margins, and a firm financial position where its business cash flow sufficiently handles debt. This monetary strength is important, as it gives the company the means to put money back into its growth projects without taking on too much debt, a usual problem for aggressive growth companies.
Chart Arrangement for a Possible Advance
While solid basics give the "why" for an investment, chart study can assist with the "when." The search process specifically seeks stocks creating chart advance formations, indicating a time of sideways movement may be coming to a close. MercadoLibre’s chart study shows such a situation.
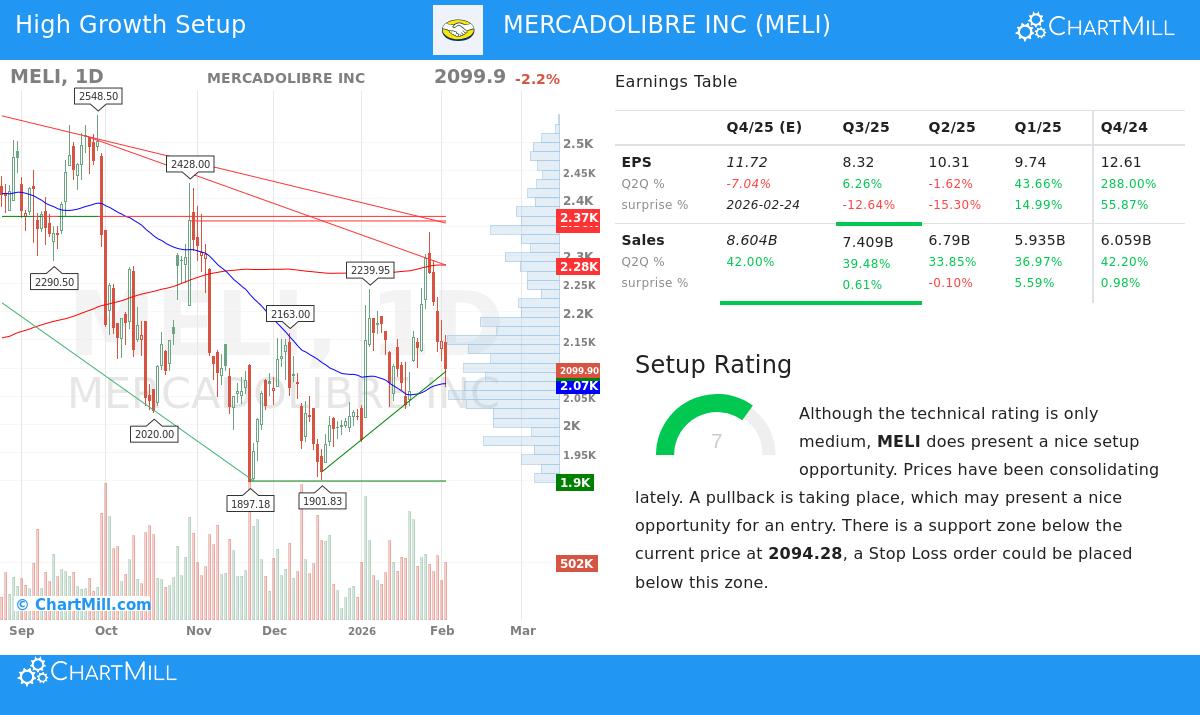
The stock presently has a middle long-term and short-term direction. However, the Setup Rating is a significant 7 out of 10. The study notes that "prices have been moving sideways recently" inside a set band, and "a decline is happening, which may offer a good chance for a purchase."
- Main Support and Resistance: The stock is changing hands close to noted support points, with an area near $2,072 to $2,094 viewed as important. Staying above this zone could offer a base.
- Sideways Movement Background: After a good multi-year increase, the recent time of flat to lower activity can be seen as a normal pause, letting the stock absorb its earlier rises. The arrangement proposes this pause phase may be preparing for its next trend move.
Price Assessment Factors
The main difficulty for investors in MercadoLibre is its price assessment, which scores a 3 out of 10. With a Price-to-Earnings (P/E) ratio over 50, the stock is clearly costly by normal measures. This is a common feature of fast-growth companies where investors are paying for future earnings possibility instead of current earnings. The search plan recognizes this by concentrating on growth and chart arrangement, suggesting that the expected price advance and continued earnings enlargement could validate the present high price over time. It is, however, a point of danger that needs belief in the company's long-term growth narrative.
A Meeting of Signs
MercadoLibre offers a strong example for the joined basic and chart search method. Basically, it is an engine of growth with a profitable, monetarily sound business design leading a high-opportunity market. Technically, it is coming out of a time of sideways movement with a set arrangement that market participants monitor for possible purchase points. The high price assessment is the offset, requiring a greater level of trust in the company's capacity to meet its growth predictions.
For investors wanting to locate other companies that display this mix of solid growth basics and hopeful chart shapes, more study can be done using the set Strong Growth Stock Technical Setups Screen.
Disclaimer: This article is for information only and does not make up financial guidance, a suggestion, or a deal to purchase or sell any securities. Investing carries danger, including the possible loss of original money. You should do your own study and talk with a certified financial consultant before making any investment choices. The basic data mentioned comes from ChartMill's study of company reports, and the chart study is based on past price activity, which is not a guide for future outcomes.