
For investors who use charts and price action to guide their choices, a methodical way to find possible trades is important. One such technique looks for stocks that show both good basic technical condition and a clear, useful chart pattern. This method centers on finding securities that are in clear upward trends but are now moving sideways, indicating they may be preparing for their next important price change. By joining a high technical rating with a high setup quality score, traders try to find chances where the chance of a good breakout is higher.
Medtronic PLC (NYSE:MDT), a worldwide leader in medical technology, has recently been found by such a scan. The company's stock is showing a chart formation that often gets the notice of technical investors searching for clear risk-reward situations.
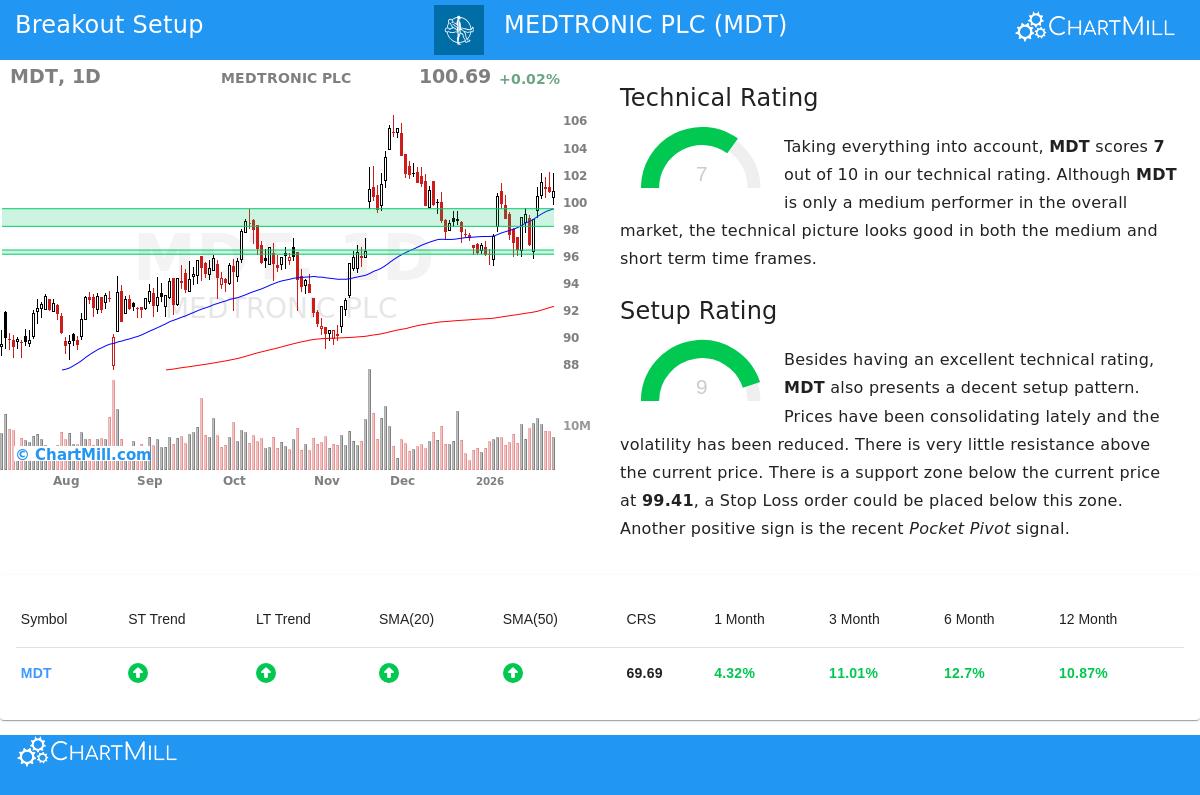
Looking at the Technical Base
The first part of this method is checking a stock's technical condition, which shows a lasting upward trend. According to the detailed technical report for MDT, the stock gets a good technical rating of 7 out of 10. This number shows positive movement across several time periods, an important check for avoiding stocks in downward trends or flat patterns that may not have clear direction.
Important technical good points for Medtronic include:
- Trend Agreement: Both the near-term and longer-term trends are seen as positive. This agreement across time periods is a clear sign of steady buying interest.
- Moving Average Help: The stock is priced above its important moving averages (20, 50, 100, and 200-day), and all these averages are in rising arrangements. This makes a layered support structure below the present price.
- Relative Results: While MDT is not a top market performer, it is doing as well as the wider market, doing better than 69% of all stocks over the last year. Inside its competitive Health Care Equipment & Supplies field, it does better than 76% of similar companies.
This good technical background is necessary for the method because it makes it more likely that any breakout from a sideways phase will keep going in the direction of the main trend, instead of stopping or turning down.
Judging the Setup Quality
A clear upward trend by itself is not a signal to buy; getting in at a high price can lead to quick declines. The second important check is the setup quality, which finds useful sideways patterns. This is where MDT really is notable, having a very good setup rating of 9 out of 10.
The study notes several traits of a good-quality setup:
- Price Sideways Movement: The stock has been trading in a set area between about $95 and $102 over the last month, letting it absorb its recent increases and form a new base of support.
- Lowered Price Swings: This time of sideways movement has happened at the same time as a drop in price swings, which often comes before a clear price change.
- Clear Support and Risk Control: A well-set support area is found between $98.11 and $99.41, made by a combination of trendlines and moving averages. This gives a sensible area to put a protective stop-loss order, setting the trade's risk from the start.
- Positive Indicator: A recent "Pocket Pivot" signal, a price increase on higher-than-normal volume, was seen, hinting at buying by bigger investors.
This high setup score speaks directly to the "when to buy" question of the method. It shows the stock is not overpriced and is instead gathering force near the top of its range, giving a possible entry point with a close support level to control risk.
A Possible Trade Plan
Based on this technical and setup study, a specific trade idea is made. The suggested entry is a buy stop order at $102.11, just above the recent sideways high, which would activate only if the stock moves to break out. The planned exit (stop-loss) is at $98.10, just below the important support area. This plan limits the theoretical worst-case risk to about 3.9% on the trade.
It is very important to know this is an example made from a number-based model. Traders should always do their own study, thinking about things like overall market state, now positive for the S&P 500, and coming company-specific events like earnings reports.
Finding Like Chances
The scan that found Medtronic's setup is done each day to discover new possible breakout choices. Investors wanting to see the present list of stocks meeting like technical and setup rules can look at the live results through the Technical Breakout Setups screen.
Disclaimer: This article is for information only and is not investment advice, a suggestion, or an offer or request to buy or sell any securities. The study shown is based on technical measures and should not be the only reason for any investment choice. All trading and investment choices include risk, including the chance of losing the original investment. Readers should do their own research and talk with a qualified financial expert before making any investment choices.


