
As investors continue to seek opportunities that blend strong fundamental growth with favorable technical patterns, a combined analytical approach has become popular with those looking for timely entry points in high-potential equities. One such strategy involves screening for stocks showing solid earnings and revenue expansion, key hallmarks of growth investing, while also displaying technical breakout formations that indicate upward momentum. This method tries to capture companies not only with good underlying business performance but also with market sentiment aligning for potential near-term appreciation.
McKesson Corp (NYSE:MCK) recently appeared from a screen made to find strong growth stocks showing promising technical setups. The healthcare distribution and services giant has shown notable fundamental strength, particularly in growth metrics, while its chart pattern indicates consolidation near resistance levels, a configuration often preceding breakouts.
Fundamental Growth Strength
McKesson's fundamental profile shows several characteristics that growth investors typically seek:
- Impressive Historical Growth: The company has delivered revenue growth of 20.35% over the past year, significantly above industry averages. More importantly, this isn't a one-time event, revenue has grown at an average annual rate of 9.22% over recent years, showing consistent expansion.
- Earnings Momentum: Earnings per share has grown by 19.44% in the past year, with a three-year average growth rate of 17.17%. This dual growth in both top and bottom lines indicates efficient scaling and operational quality.
- Future Growth Expectations: Analysts project continued growth with EPS expected to increase by 12.90% annually and revenue forecast to grow at 8.70%, solid figures for a company of McKesson's scale in the healthcare sector.
These growth metrics are particularly relevant because, as established in growth investing principles, companies showing accelerating or sustained high growth rates relative to their industry peers often present the best opportunities for capital appreciation. McKesson's growth ratings reflect this strength, scoring 7 out of 10 in ChartMill's fundamental analysis system, placing it among the stronger growth companies in its sector.
Technical Setup Analysis
The technical picture adds to this fundamental strength with several encouraging patterns:
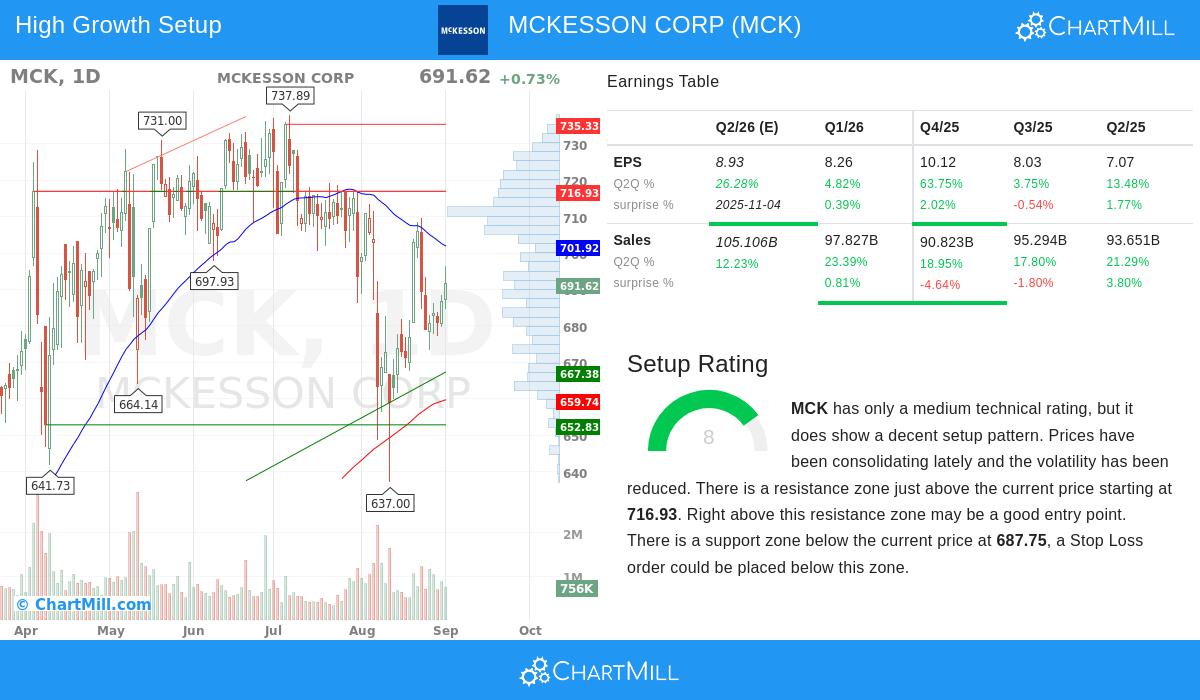
- Consolidation Pattern: McKesson has been trading in a defined range between approximately $637 and $714 over the past month, showing reduced volatility and price compression that often comes before significant moves.
- Support and Resistance Levels: The stock has established strong support around the $687 level, formed through a combination of moving averages and trendlines across multiple timeframes. Resistance sits in the $716-735 zone, which represents a key breakout level.
- Long-Term Trend Strength: Despite recent consolidation, the long-term trend remains positive with the stock trading well above its 200-day moving average. The stock has outperformed 76% of all market stocks over the past year, showing relative strength.
This technical configuration is significant because breakout patterns happening in stocks with strong fundamentals often lead to more sustained advances. The reduced volatility during consolidation typically represents balance between buyers and sellers, which when resolved through a breakout, can start a new trend phase.
Additional Fundamental Considerations
Beyond growth metrics, McKesson displays several supportive fundamental characteristics:
- Profitability: The company maintains a 5 out of 10 profitability rating, with particularly strong returns on invested capital at 24.26%, outperforming 97% of industry peers. This indicates efficient use of capital despite operating in a low-margin distribution business.
- Financial Health: With a moderate health rating of 5, McKesson shows excellent solvency metrics including a strong Altman-Z score of 5.68, indicating low bankruptcy risk. However, investors should note weaker liquidity ratios, which is common in working-capital intensive distribution businesses.
- Valuation: Trading at a P/E ratio of 20.66, McKesson appears reasonably valued compared to both the S&P 500 average and industry peers. The PEG ratio, which accounts for growth expectations, suggests fair valuation given the company's growth prospects.
The combination of strong growth, reasonable valuation, and solid profitability creates a fundamental foundation that supports the potential technical breakout. As growth investing principles emphasize, companies with these characteristics often represent opportunities where business performance may not be fully reflected in the current stock price.
Industry Context and Market Position
McKesson operates in the healthcare distribution sector, which has shown resilience during various market conditions. As one of the largest pharmaceutical distributors in North America, the company benefits from:
- Essential nature of healthcare products, providing revenue stability
- Scale advantages that create barriers to entry for competitors
- Diversified operations across pharmaceutical distribution, medical-surgical solutions, and prescription technology services
The company's market position supports its growth trajectory, as healthcare spending continues to grow with demographic tailwinds and increasing healthcare utilization.
For investors interested in exploring similar opportunities that combine strong growth fundamentals with favorable technical patterns, additional screening results can be found through this Strong Growth Stocks with Good Technical Setup Ratings screen.
Detailed fundamental and technical analysis reports for McKesson are available for further review: Fundamental Analysis Report | Technical Analysis Report
Disclaimer: This analysis is provided for informational purposes only and does not constitute investment advice, a recommendation, or an offer to buy or sell any securities. Investors should conduct their own research and consult with a qualified financial advisor before making investment decisions. Past performance is not indicative of future results.