
MCKESSON CORP (NYSE:MCK) has been identified as a high-growth momentum stock that aligns with Mark Minervini’s Trend Template. The company demonstrates strong technical trends and solid fundamental growth, making it a candidate worth examining for investors focused on high-growth opportunities.
Why MCK Fits the Minervini Trend Template
Minervini’s strategy emphasizes stocks in strong uptrends with clear technical strength. MCK meets these criteria:
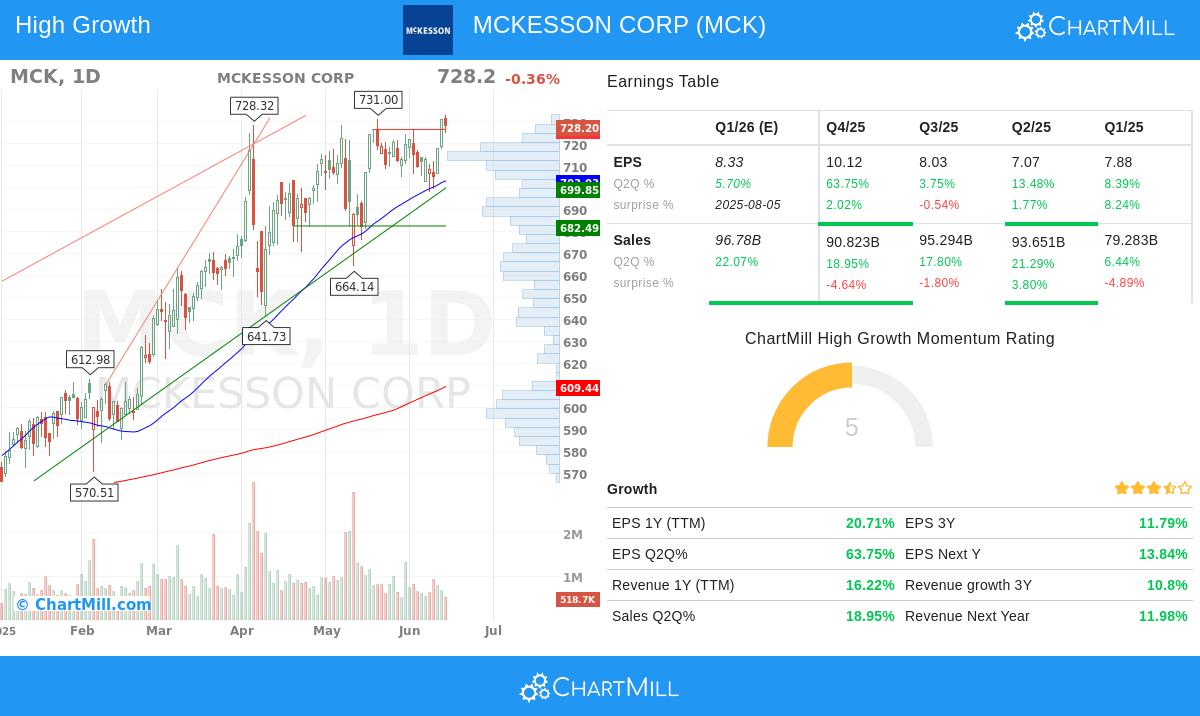
- Price Above Key Moving Averages: The stock trades above its 50-day ($703.03), 150-day ($642.28), and 200-day ($609.44) moving averages, confirming a bullish trend.
- Rising Moving Averages: Both the 150-day and 200-day MAs are trending upward, reinforcing long-term strength.
- Relative Strength: With a ChartMill Relative Strength (CRS) score of 84.05, MCK outperforms 84% of the market.
- Near 52-Week High: The stock is trading within 1% of its 52-week high ($732.99), indicating strong momentum.
- Volatility Contraction: The technical report highlights a consolidation phase with reduced volatility, suggesting a potential breakout opportunity.
High Growth Fundamentals
Beyond technicals, MCK exhibits strong growth metrics:
- Earnings Growth: EPS grew 63.75% year-over-year in the latest quarter, with TTM EPS growth at 20.71%.
- Revenue Growth: Sales increased by 18.95% in the most recent quarter, with TTM revenue growth at 16.22%.
- Free Cash Flow Growth: FCF per share surged 44.09% over the past year, indicating strong cash generation.
- Profit Margin Expansion: Quarterly profit margins improved from 0.26% two quarters ago to 1.39% in the latest report.
Technical Outlook
The ChartMill technical report rates MCK at 10/10, citing:
- Strong long-term and short-term uptrends.
- A consolidation phase with support near $695.75-$726.40.
- Resistance around $728.21-$730.81, with a potential breakout above $730.82.
Our High Growth Momentum + Trend Template screener lists more stocks with similar growth and technical strength.
Disclaimer
This is not investment advice. Always conduct your own research before making any investment decisions.