
For long-term investors aiming to assemble a portfolio of good companies, few methods are as lasting as the one made famous by renowned fund manager Peter Lynch. His method, explained in One Up on Wall Street, centers on finding expanding companies with fair prices, good financial condition, and durable business models. It is a view frequently called Growth at a Reasonable Price (GARP), which mixes the search for increase with a careful focus on price. By using a group of particular financial filters, investors can search for companies that match this careful, long-term view.
One company that recently passed through such a search is Lululemon Athletica Inc (NASDAQ:LULU). The athletic apparel seller seems to meet many of the items Lynch viewed as important for a profitable long-term investment. Let's review how Lululemon's financial picture matches the central parts of this method.
Match with Lynch's Investment Rules
Peter Lynch’s structure stresses durable increase, earnings, financial soundness, and good price. The search rules taken from his work give a numerical beginning for review.
- Durable Earnings Increase: Lynch preferred companies with good, but not extreme, increase. The search requires a 5-year earnings per share (EPS) increase rate between 15% and 30%, fast enough to be interesting, but slow enough to be possibly durable. Lululemon’s 5-year EPS increase rate of 24.37% rests well inside this goal area, showing a record of solid and managed increase.
- Fair Price (PEG Ratio): Maybe the central idea of the GARP method is the Price/Earnings to Growth (PEG) ratio. Lynch looked for companies with a PEG of 1 or lower, meaning the stock price is fair compared to its earnings increase. Lululemon’s PEG ratio, based on its past increase, is 0.51. This shows the market may be pricing its historical increase path too low, a main sign for price-aware growth investors.
- Good Earnings (Return on Equity): A high Return on Equity (ROE) shows a company’s skill at creating profits from shareholder money. Lynch used a lowest limit of 15%. Lululemon greatly passes this with an ROE of 40.70%, putting it in the best group of its industry and signaling excellent management performance and a strong brand advantage.
- Sound Financial Condition (Debt & Cash): Lynch was cautious about high debt. The search needs a Debt-to-Equity ratio below 0.6, with Lynch himself liking levels under 0.25. Notably, Lululemon has no interest-bearing debt, giving it special balance sheet freedom and strength. Also, its Current Ratio of 2.27 shows more than enough short-term assets to pay its near-term debts, passing Lynch’s cash test without trouble.
A Wide Basic Summary
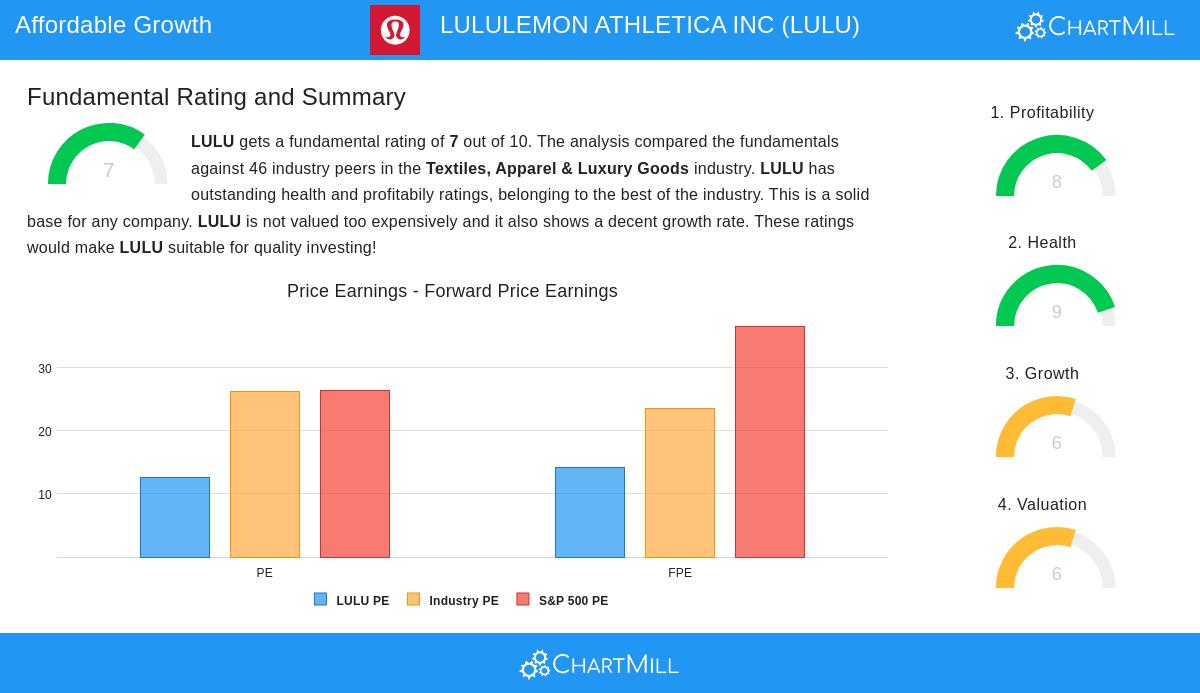
A wider view of Lululemon’s basic report supports the image shown by the Lynch search. The company gets a good total score of 7 out of 10, with special good points in two areas Lynch valued: earnings and financial condition.
Its earnings numbers are excellent, with industry-best figures for Return on Assets (23.74%), Return on Invested Capital (29.67%), and Profit Margin (16.38%). This steady skill to turn sales into profit is a mark of a good business. The financial condition score is almost perfect at 9 out of 10, supported by the no-debt position and a solid Altman-Z score of 7.80, which means a very small chance of financial trouble.
The price score is a middle 6, with the review noting that while Lululemon’s P/E ratio of 12.52 is low compared to the wider S&P 500, it is priced fairly inside its own competitive high-end apparel industry. The increase score is also a 6, reflecting a excellent past increase record that is thought to slow to a more usual, but still good, speed in the next years. You can examine the full basic review closely here.
Closing
For investors following the ideas of Peter Lynch, Lululemon Athletica offers an interesting example. It shows the strong mix of a good brand, a record of high earnings, and a very strong balance sheet, all available at a price that, when changed for its increase, seems fair. While future increase is expected to be more measured, the company’s financial control and market place give a good base for long-term growth.
It is key to recall that a search is only a beginning for more study. Lynch himself stressed the need to know the business you invest in. Does Lululemon’s product creation and worldwide growth plan make sense to you as a durable long-term strategy?
Want to look at other companies that fit this careful investment method? You can use the Peter Lynch search yourself and see the present outcomes here.
,
Disclaimer: This article is for information only and is not financial advice, a suggestion, or an offer to buy or sell any securities. The review is based on data and a particular investment method structure, it is not a replacement for your own study and care. Investing has risk, including the possible loss of original money.