
Our stock screening tool has pinpointed STRIDE INC (NYSE:LRN) as a growth stock that isn't overvalued. LRN is excelling in various growth indicators while maintaining a solid financial footing. Furthermore, it remains attractively priced. Let's delve into the specifics below.
Exploring LRN's Growth
A key component of ChartMill's stock assessment is the Growth Rating, which spans from 0 to 10. This rating evaluates diverse growth factors, such as EPS and revenue growth, considering both past performance and future projections. LRN has received a 7 out of 10:
- LRN shows a strong growth in Earnings Per Share. In the last year, the EPS has been growing by 51.26%, which is quite impressive.
- LRN shows a strong growth in Earnings Per Share. Measured over the last years, the EPS has been growing by 39.31% yearly.
- The Revenue has grown by 13.13% in the past year. This is quite good.
- Measured over the past years, LRN shows a quite strong growth in Revenue. The Revenue has been growing by 14.97% on average per year.
- The Earnings Per Share is expected to grow by 20.90% on average over the next years. This is a very strong growth
- The Revenue is expected to grow by 9.53% on average over the next years. This is quite good.
Assessing Valuation Metrics for LRN
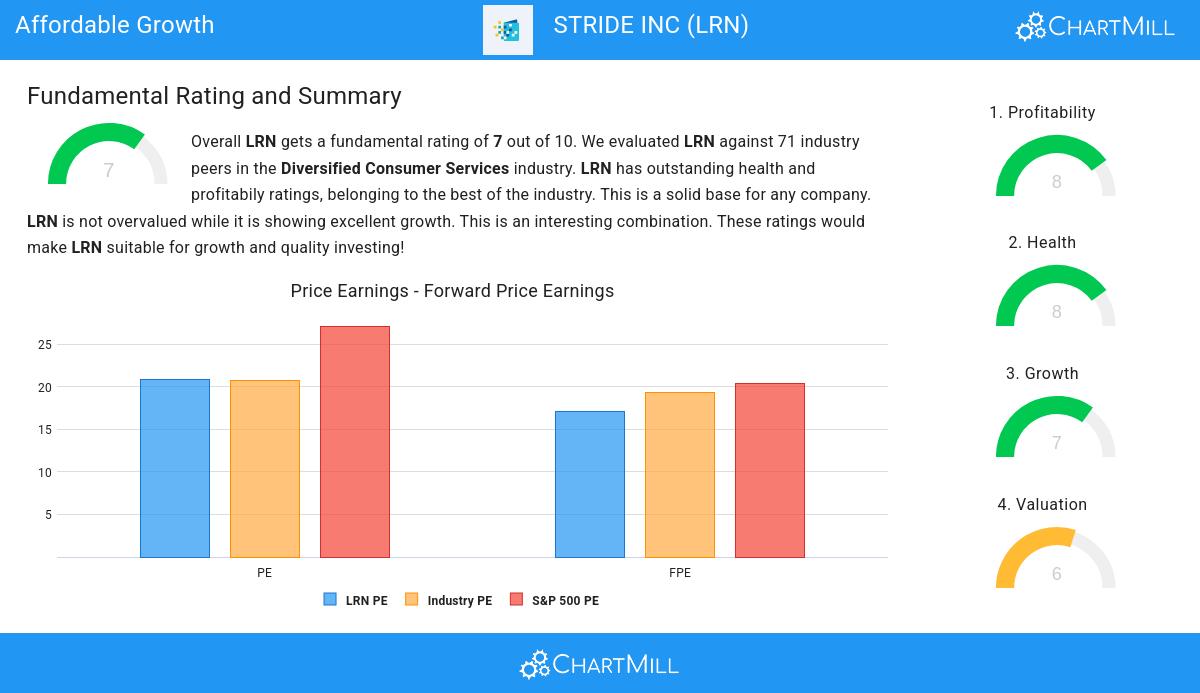
ChartMill assigns a Valuation Rating to every stock. This score ranges from 0 to 10 and evaluates the different valuation aspects and compares the price to earnings and cash flows, while taking into account profitability and growth. LRN scores a 6 out of 10:
- Compared to the rest of the industry, the Price/Earnings ratio of LRN indicates a somewhat cheap valuation: LRN is cheaper than 63.38% of the companies listed in the same industry.
- LRN is valuated rather cheaply when we compare the Price/Earnings ratio to 27.10, which is the current average of the S&P500 Index.
- 67.61% of the companies in the same industry are more expensive than LRN, based on the Price/Forward Earnings ratio.
- Based on the Enterprise Value to EBITDA ratio, LRN is valued a bit cheaper than the industry average as 64.79% of the companies are valued more expensively.
- 66.20% of the companies in the same industry are more expensive than LRN, based on the Price/Free Cash Flow ratio.
- The low PEG Ratio(NY), which compensates the Price/Earnings for growth, indicates a rather cheap valuation of the company.
- LRN has an outstanding profitability rating, which may justify a higher PE ratio.
- A more expensive valuation may be justified as LRN's earnings are expected to grow with 20.90% in the coming years.
Health Examination for LRN
A critical element of ChartMill's stock evaluation is the Health Rating, which spans from 0 to 10. This rating considers multiple health factors, including liquidity and solvency, both in absolute terms and relative to industry peers. LRN has received a 8 out of 10:
- An Altman-Z score of 7.07 indicates that LRN is not in any danger for bankruptcy at the moment.
- With an excellent Altman-Z score value of 7.07, LRN belongs to the best of the industry, outperforming 92.96% of the companies in the same industry.
- LRN has a debt to FCF ratio of 1.96. This is a very positive value and a sign of high solvency as it would only need 1.96 years to pay back of all of its debts.
- The Debt to FCF ratio of LRN (1.96) is better than 78.87% of its industry peers.
- LRN has a Debt/Equity ratio of 0.35. This is a healthy value indicating a solid balance between debt and equity.
- A Current Ratio of 6.02 indicates that LRN has no problem at all paying its short term obligations.
- LRN has a Current ratio of 6.02. This is amongst the best in the industry. LRN outperforms 92.96% of its industry peers.
- A Quick Ratio of 5.93 indicates that LRN has no problem at all paying its short term obligations.
- Looking at the Quick ratio, with a value of 5.93, LRN belongs to the top of the industry, outperforming 92.96% of the companies in the same industry.
Analyzing Profitability Metrics
Discover ChartMill's exclusive Profitability Rating, a proprietary metric that assesses stocks on a scale of 0 to 10. It takes into consideration various profitability ratios and margins, both in absolute terms and relative to industry peers. Notably, LRN has achieved a 8:
- LRN has a better Return On Assets (13.03%) than 91.55% of its industry peers.
- With an excellent Return On Equity value of 20.46%, LRN belongs to the best of the industry, outperforming 87.32% of the companies in the same industry.
- Looking at the Return On Invested Capital, with a value of 13.60%, LRN belongs to the top of the industry, outperforming 90.14% of the companies in the same industry.
- The last Return On Invested Capital (13.60%) for LRN is above the 3 year average (9.47%), which is a sign of increasing profitability.
- With an excellent Profit Margin value of 12.30%, LRN belongs to the best of the industry, outperforming 83.10% of the companies in the same industry.
- LRN's Profit Margin has improved in the last couple of years.
- Looking at the Operating Margin, with a value of 15.25%, LRN belongs to the top of the industry, outperforming 80.28% of the companies in the same industry.
- LRN's Operating Margin has improved in the last couple of years.
- LRN's Gross Margin has improved in the last couple of years.
Every day, new Affordable Growth stocks can be found on ChartMill in our Affordable Growth screener.
Our latest full fundamental report of LRN contains the most current fundamental analsysis.
Disclaimer
This article should in no way be interpreted as advice. The article is based on the observed metrics at the time of writing, but you should always make your own analysis and trade or invest at your own responsibility.