
In the world of growth investing, combining a strict technical plan with attention to fundamental momentum can be a strong method. The system used here brings together Mark Minervini’s Trend Template, a step-by-step list for finding stocks in clear, strong uptrends, with a filter for High Growth Momentum (HGM). The aim is to locate companies that are showing both firm price movement and institutional backing, and are also supported by improving business basics. This two-part method tries to find leaders early in their growth phases, where technical health and fundamental gain meet to build a chance for notable gains.
Liquidia Corp (NASDAQ:LQDA) comes from this mixed screening process, offering an example of how a biopharmaceutical company can match both an orderly trend-following plan and the forceful growth shape desired by momentum investors.
Technical Base: Matching the Minervini Trend Template
Mark Minervini’s plan is based on trading in the direction of the firmest trends, thus moving with institutional money flow. The Trend Template’s rules are made to remove weak or consolidating stocks, concentrating only on those showing definite, multi-timeframe health. A look at Liquidia’s chart and main measures shows it currently meets the central technical list:
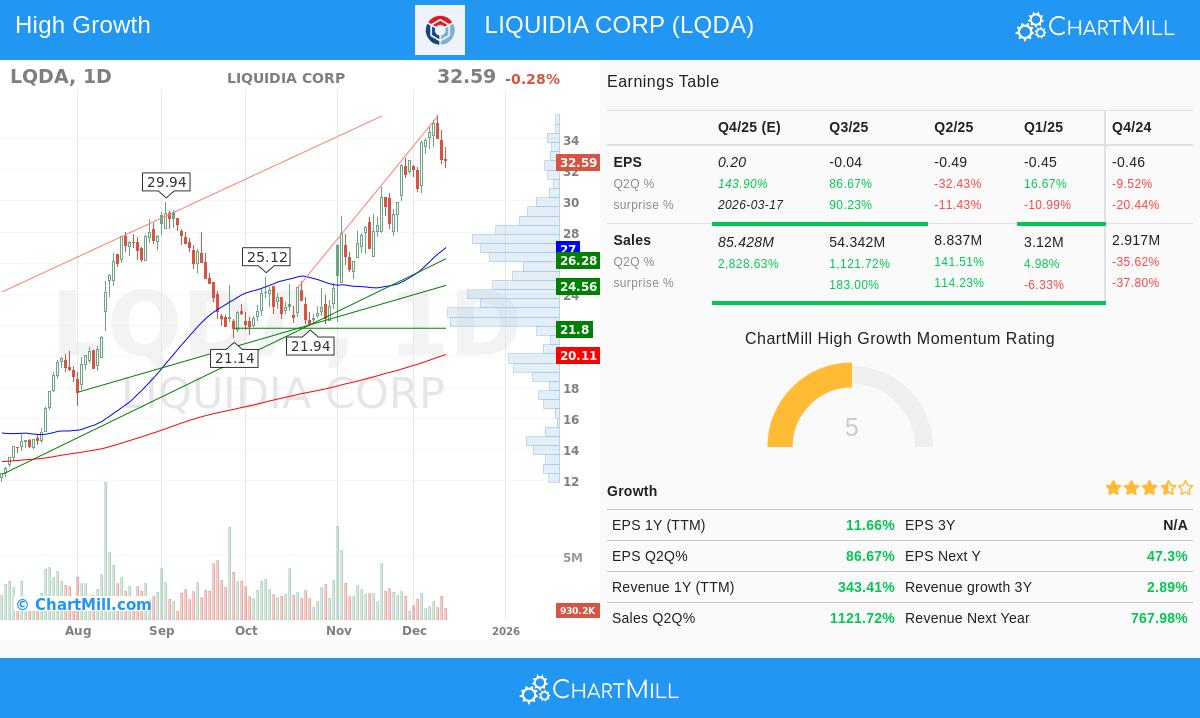
- Price Above Key Moving Averages: The stock trades at $32.59, much higher than its rising 50-day ($27.00), 150-day ($22.02), and 200-day ($20.11) simple moving averages. This ordered position signals continued buying across short, medium, and long-term periods.
- Moving Average Order: The 50-day SMA is positioned above both the 150-day and 200-day SMAs, and the 150-day SMA is above the 200-day SMA. This successive positive order is a standard sign of a stock in a firm Stage 2 climb.
- Nearness to Highs: At its present price, LQDA is trading within 25% of its 52-week high of $35.54, a main Minervini rule that focuses on health instead of low price. At the same time, the stock is more than 200% above its 52-week low of $10.37, showing a strong recovery and upward trend.
- Strong Relative Performance: With a ChartMill Relative Strength (CRS) score of 97.36, LQDA is doing better than almost 98% of all stocks in the market. This outstanding relative performance is essential in the Minervini system, as it finds real market leaders.
This technical view meets the Trend Template’s aim: to make sure an investor is only looking at stocks where the easiest direction is clearly upward, supported by broad market gains.
Fundamental Momentum: The High Growth Shape
While the Trend Template confirms a sound chart, the High Growth Momentum filter looks for companies with improving business basics. For a clinical-stage biopharma like Liquidia, this is often seen in pipeline progress, regulatory events, and changing financial forecasts. The given data indicates important fundamental momentum:
- Fast Revenue Path: The most notable number is the trailing twelve-month (TTM) revenue increase of over 343%. More currently, last quarter’s sales rose by a notable 1,121% year-over-year. This type of gain is a main goal for growth investors, signaling a product or technology hitting a turning point.
- Analyst Confidence and Changes: Possibly one of the firmest signs for momentum investors is positive changes from analysts. For LQDA, the average guess for next year’s earnings has been changed upward by 45.76% over the last three months, while next year’s revenue guess has been changed up by 117.34%. Such strong upward changes often come before continued positive momentum as institutional models are updated.
- Earnings Improvement: Although the company is not yet profitable on a net basis (EPS TTM is -$1.44), there are indicators of gain. The EPS increase on a TTM basis is positive at 11.66%, and the last quarter showed major year-over-year improvement. For growth-phase biotech, the path and cause for losses (large spending on commercialization) are often as critical as the profit itself.
This mix of fast sales increase and rising analyst hopes builds the fundamental "driver" that high-growth plans aim to follow, especially when paired with a technically healthy chart.
Combination: Why LQDA Matches the Mixed Plan
The link between the technical and fundamental filters is what makes this system strong. The Trend Template confirms that the market is seeing and valuing Liquidia’s fundamental story. The firm upward trend, high relative performance, and order of moving averages suggest institutional investors are buying shares in expectation of or in response to the company’s advances, particularly around its lead candidate, YUTREPIA, for pulmonary hypertension.
On the other hand, the High Growth Momentum measures give the "reason" behind the chart health. The large revenue increase and positive analyst changes offer a fundamental cause for the stock’s technical rise and leader position. In Minervini’s SEPA (Specific Entry Point Analysis) method, this fundamental event is a key part next to trend and entry point.
Technical Health Summary
A look at the detailed ChartMill Technical Analysis Report for LQDA gives the stock a complete technical score of 10 out of 10. The report mentions steady results across all time frames, with both long-term and short-term trends scored as positive. The stock is doing better than 97% of the market and 90% of its pharmaceutical industry group. While the report notes that the recent trading band has been wide and the current setup score is not perfect for a new entry, suggesting changes that may need waiting for a pause, the basic technical health is called very good. Key support areas are found between $32.58 and $21.80, giving clear points for risk planning.
Locating Like Chances
For investors curious in using this same orderly search for high-growth leaders in clear uptrends, the screening process that found Liquidia Corp can be a beginning point. The mixed "High Growth Momentum + Trend Template" screen step-by-step sorts the market for companies showing this strong meeting of health.
You can view current results from this screening method here: High Growth Momentum + Trend Template Screen.
Disclaimer: This article is for information and learning only. It is not advice to buy, sell, or hold any security, including LQDA. The study is based on given data and a specific investment method. All investing includes risk, including the possible loss of principal. You should do your own full research and think about talking with a qualified financial advisor before making any investment choices. Please read our full disclaimer here.