
For investors who use technical analysis, one useful method is to find stocks that show both technical health and are set for a near-term price move. This method joins two main parts: first, verifying the stock is in a lasting upward trend, and second, waiting for it to pause its advance before its next rise. This technique aims to join a rising stock at a moment that provides a defined structure for managing risk. A specialized screening tool that looks for a high ChartMill Technical Rating and a high ChartMill Setup Quality Rating is made to find these chances, and one stock now fitting these conditions is LINCOLN NATIONAL CORP (NYSE:LNC).
Technical Health: A Firm Base
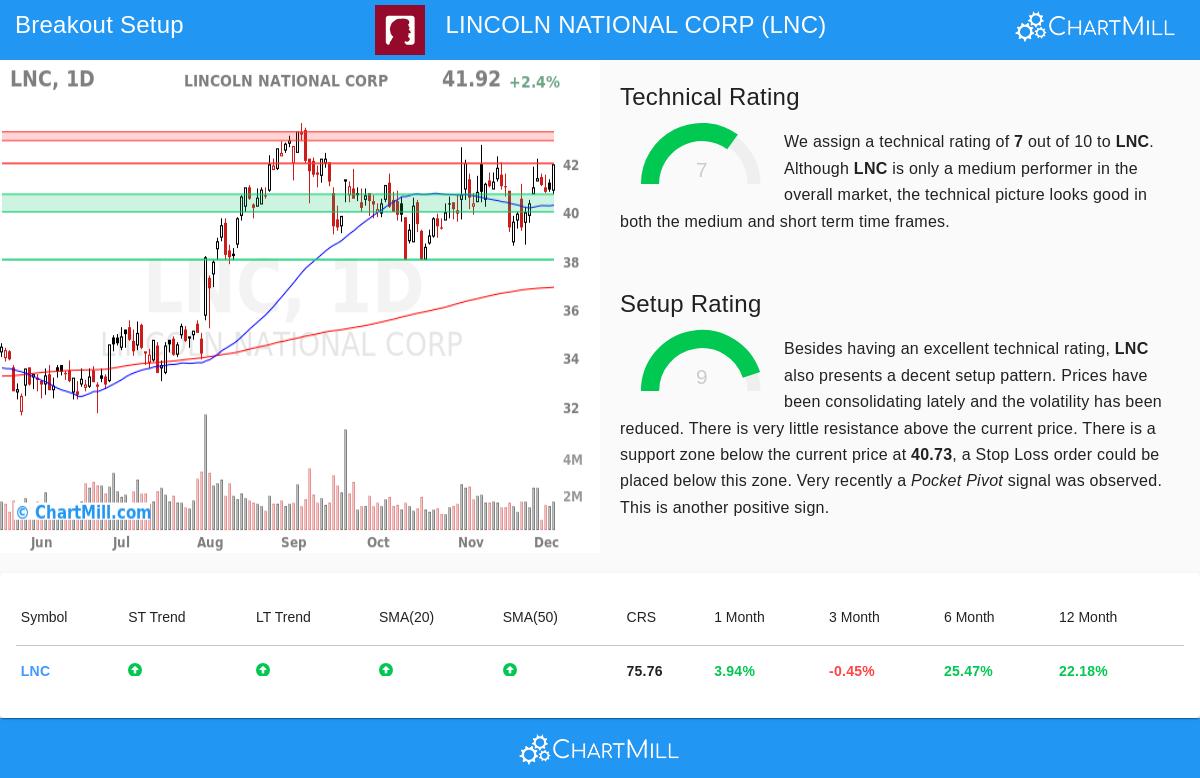
The base of any trade for a price move is the fundamental condition of the stock's trend. The ChartMill Technical Rating, a number from 0 to 10, measures this condition. A rating of 7 or more is usually seen to mark a stock in a verified uptrend. Lincoln National now has a Technical Rating of 7, indicating a sound technical state. This number is backed by several specific factors listed in its technical report.
- Trend Agreement: Both the long-term and short-term trends for LNC are scored as positive. This agreement across different periods is a standard mark of a steady, continued rise.
- Moving Average Backing: The stock is priced above all its main simple moving averages (20, 50, 100, and 200-day), and each of these averages is also rising. This forms a stacked support system below the price.
- Relative Performance: Inside the insurance field, LNC is doing better than 82% of its 148 competitors. This strength compared to the sector is a key sign of being a leader, meaning the stock's rises are not just from a general market lift but from its own force.
These factors together explain the stock's firm technical rating. For the price move method, this health is essential; it makes sure an investor is moving with the current market force, not opposing it.
Setup Quality: The Entry Method
While a firm trend is needed, it is not enough for a best trade. Buying a stock that has already risen sharply and far often results in quick declines. The best entry moment comes after a time of pause, where the stock holds its gains in a narrow band, preparing for its next rise. This is measured by the ChartMill Setup Quality Rating, also on a 0-10 scale, with higher numbers pointing to a more formed pause pattern. Lincoln National does very well here with a Setup Rating of 9.
The technical report notes why the setup looks so good:
- Pause and Lower Volatility: The stock has been moving in a set band over the last month, letting short-term moving averages approach the price. This tightening action, along with lower volatility, often comes before a new price move.
- Defined Support and Resistance: The analysis finds a solid support area between $40.00 and $40.73, made by a meeting of trendlines and moving averages. In contrast, nearby resistance is seen around $42.00. This makes a clear trading band with a specific level for a price move.
- Positive Signs: A recent "Pocket Pivot" signal—a price increase on higher volume than any decline volume day in the last ten sessions—hints at buying by larger investors, adding a good detail to the setup.
This high-grade pause directly answers the "when to buy" part of the method. It gives a reasoned entry point just above resistance ($42.01) and a reasoned stop-loss point just below support ($39.99), providing a managed, measured risk for the trade.
A Complete Look at the Chance
It is useful to see the full picture. While the technical and setup scores are strong, the report gives complete notes. The stock's good yearly performance is seen to be greatly affected by a sharp move many months ago, and it is now trading in the middle of its recent one-month band, meaning it could meet some pressure as it nears the top. Also, while LNC is trading in the higher part of its own 52-week band, it is seen as a bit behind the S&P 500, which is trading near its highest levels. These points do not cancel the positive setup but remind investors that not all signs are at their strongest.
Finding Other Stocks Set for a Move
The pairing of a firm technical base (Rating of 7) and a high-grade, tightening pause pattern (Setup Rating of 9) makes Lincoln National a stock that technical investors may want to watch for a possible price move. This particular setup was found using a systematic screen that searches the market for this exact pairing of features. For investors wanting to see other stocks now showing similar technical patterns for a price move, the screen is refreshed each day and can be found here: View Today's Technical Breakout Setups.
Disclaimer: This article is for information only and is not investment advice, a suggestion, or an offer or request to buy or sell any securities. The study is based on technical measures and past data, which are not promises of future results. All trading and investment choices have risk, including the possible loss of the amount invested. Investors should do their own study and work and think about talking with a skilled financial expert before making any investment choices.