A couple of minutes after posting a simple fundamentals-focused scan on X, one ticker jumped off the page for an entirely different reason.
I wasn’t looking for chart patterns at all.
I was hunting for companies with strong, well-rounded fundamentals in ChartMill, the kind that score well on growth, profitability, valuation, and financial health at the same time. That alone already narrows the universe dramatically.
Here’s the exact text I shared on X:
"Stocks with good fundamental ratings in ChartMill:
Profitability: 7/10 Financial health: 6/10 Valuation: 6/10 Growth: 8/10
This results in a very limited selection of only 40 stocks worldwide and 16 stocks when we limit the list to US stocks only:
$LGCY, $HALO, $NVDA, $ENVA, $AU, $SVM, $PSIX, $HRMY, $CPRX, $HCI, $MU, $AGI, $NXT, $NBIX, $CDE, $VCTR
Not surprising, of course, if a company scores well on growth, profitability, and valuation at the same time..."
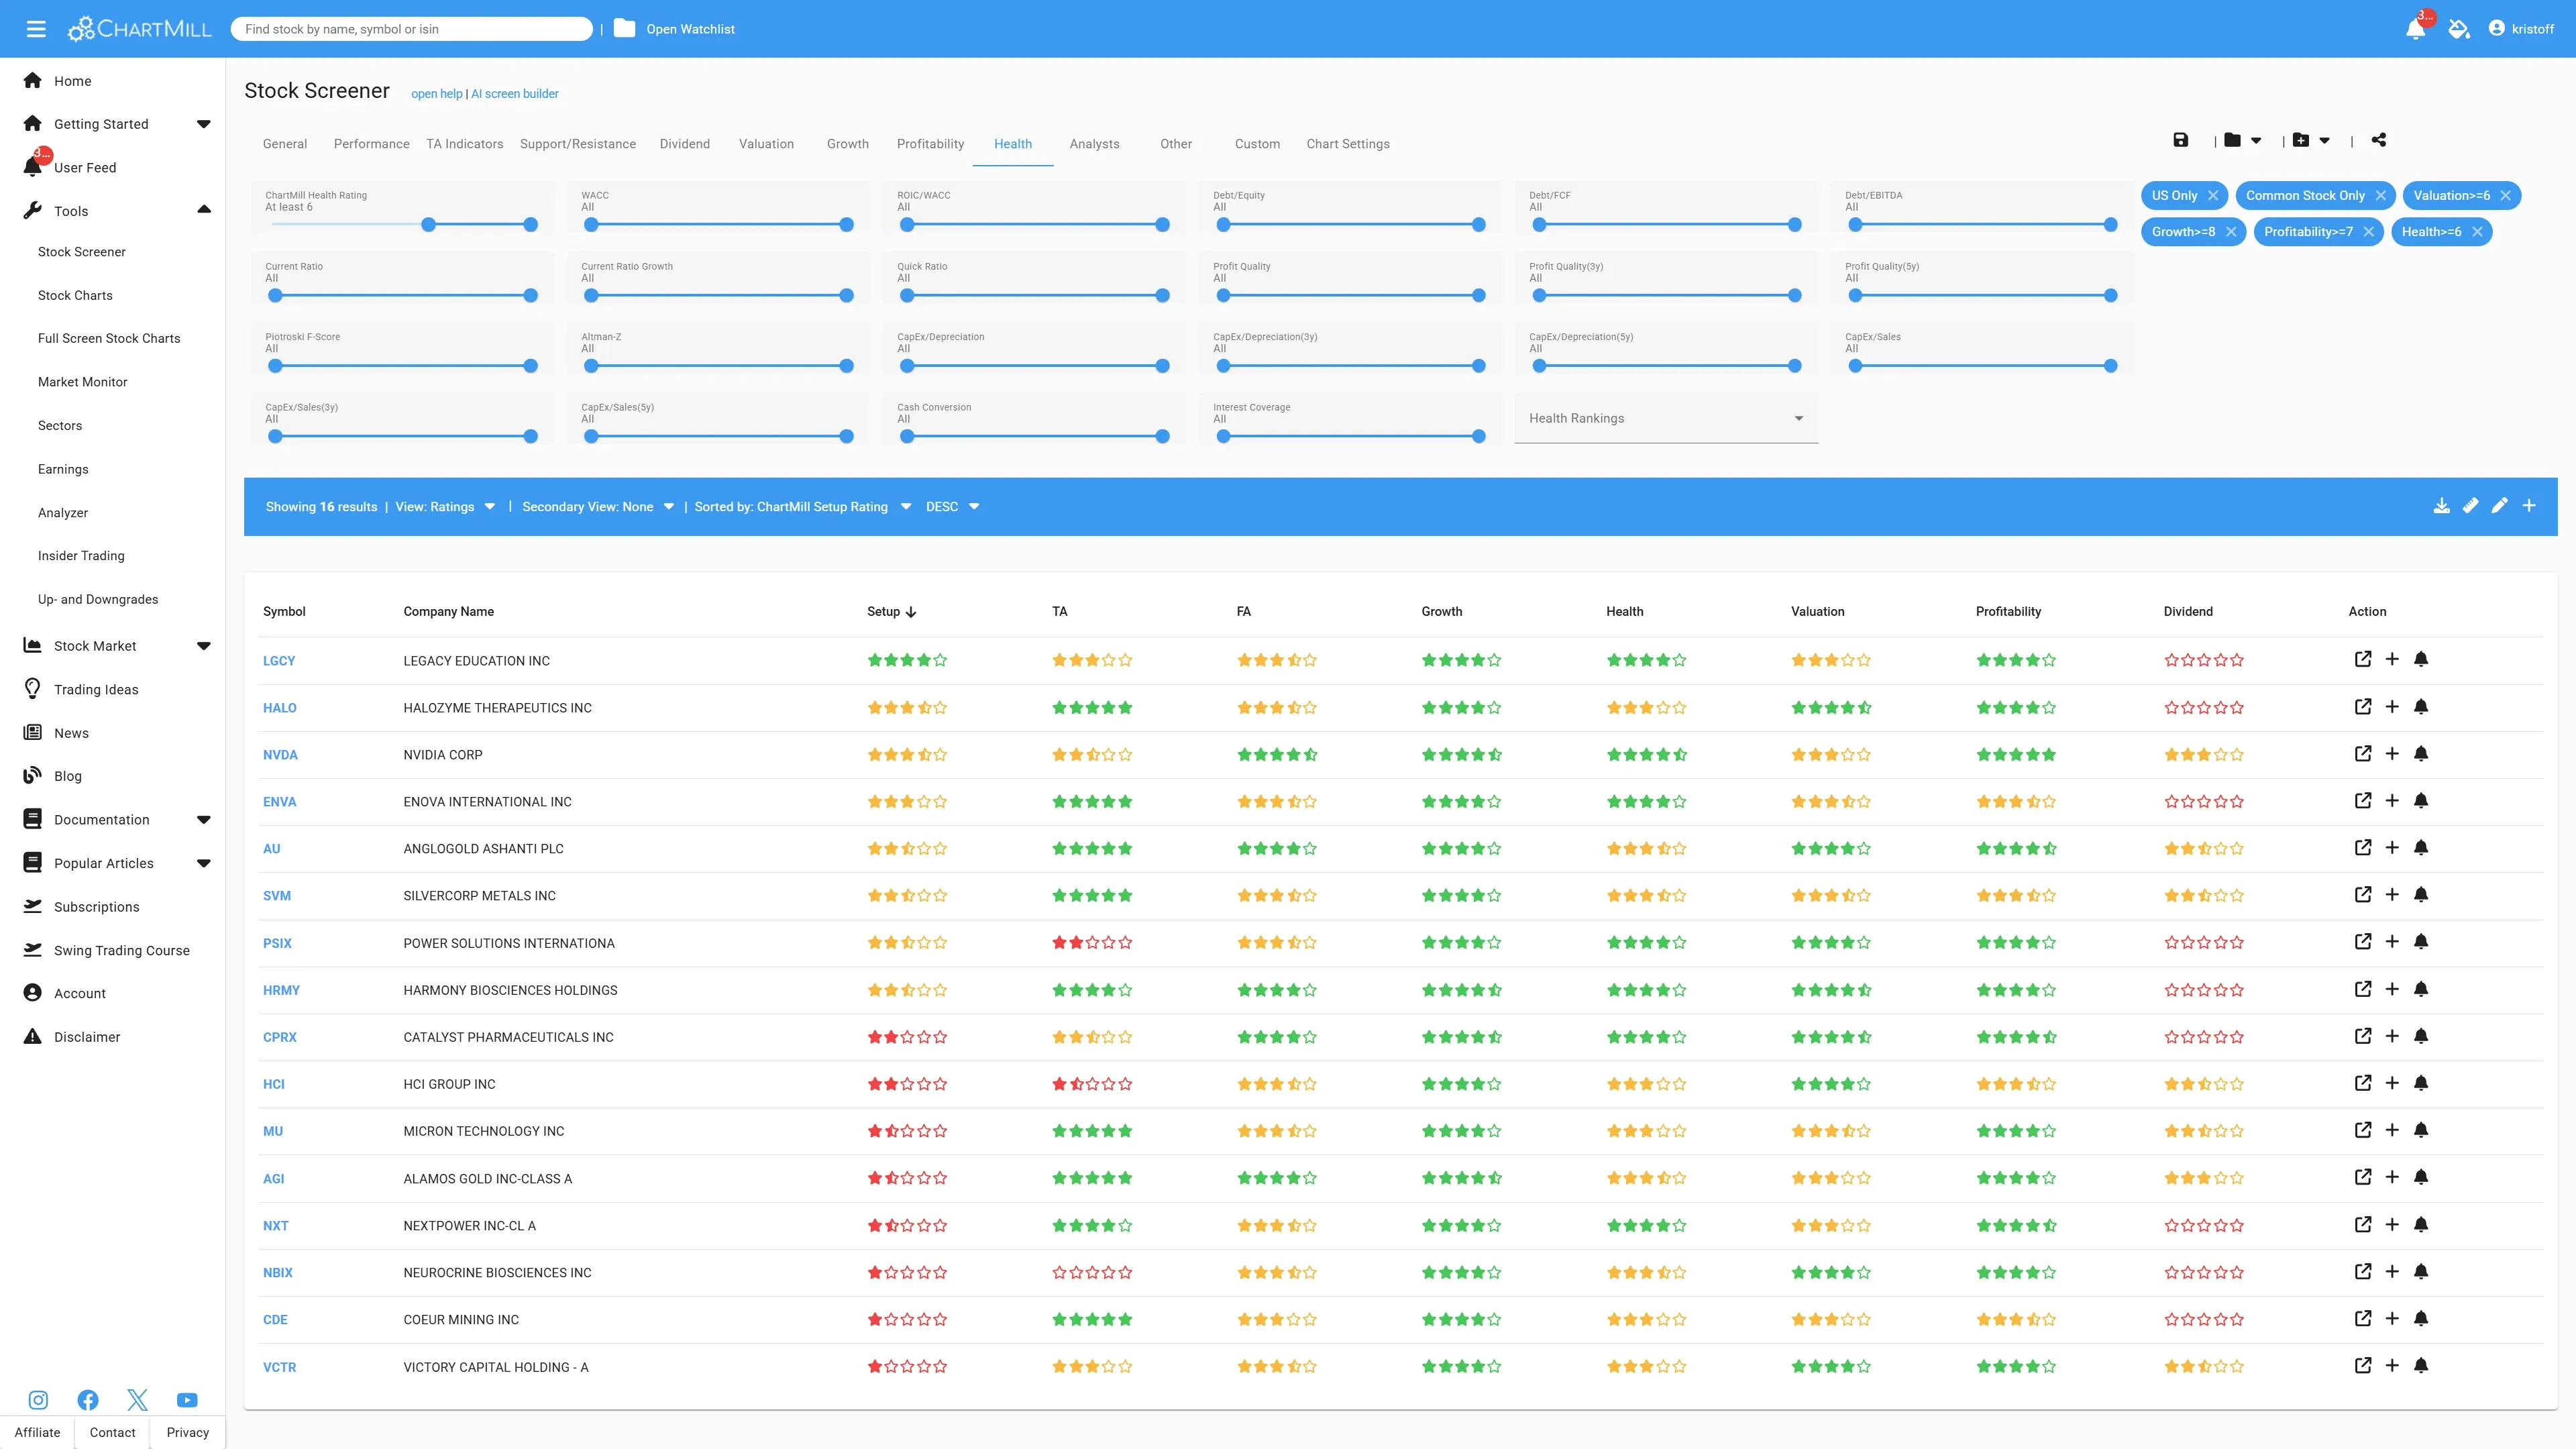
But then ChartMill did something even more interesting. The “fundamentals shortlist” that unexpectedly delivered a swing-trade setup.
When I looked at the Setup Quality scores inside that small US list, one name stood out:
- LGCY — with a 4/5 Setup Quality rating.
So now we had the best of both worlds:
-
A stock that passed strict fundamental filters (the “boring” part that matters)
-
And a chart that looks like it’s building a real launchpad (the part swing traders care about)
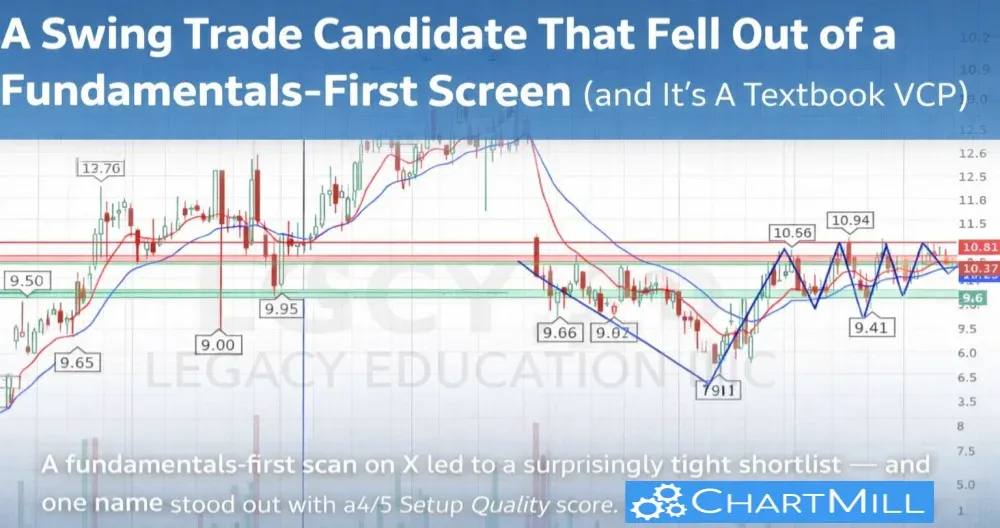
When I pulled up the daily chart, it instantly felt familiar, because it’s the same type of structure we recently covered with CVCO:
- A clean VCP (Volatility Contraction Pattern).

Why VCP patterns matter (and why this one is so clean)
A VCP is essentially a “pressure cooker” pattern:
-
After a prior uptrend, price consolidates
-
Each pullback becomes smaller
-
Each rebound becomes tighter
-
Volatility contracts as supply dries up
-
Eventually, price pushes through resistance and trends resume
What makes VCPs so attractive for swing trading is simple:
-
They often offer tight risk
-
With a clear breakout level
-
And a setup structure that’s easy to manage emotionally (and mechanically)
On the LGCY chart, you can literally see those contractions: each swing gets tighter, price holds up, and the stock keeps “loading” beneath resistance.
LGCY: what the chart is saying right now
Here’s what stands out on the daily chart:
A prior uptrend + a proper reset
LGCY already proved it can trend, then it went through a deeper correction, and now it’s rebuilding. That reset matters — it shakes out weak hands and sets the stage for cleaner continuation.
A tightening range under a clear ceiling
Price has been coiling beneath a well-defined resistance zone around ~10.8–11.0 (multiple tests, multiple rejections). The most recent candles are tighter and more controlled — exactly what you want to see before a breakout.
Higher lows (shrinking downside)
The pullbacks are getting shallower, with a notable higher low in the mid–9s area. That’s the volatility contraction part doing its job.
Moving averages are catching up
The shorter-term averages are rising and compressing into price, another common “spring-loading” behavior in strong bases.
This is the kind of chart where the next meaningful move is often triggered by one thing:
A decisive breakout through resistance, ideally on volume.
A simple swing-trade framework for this setup
Not advice, just a clean, repeatable way swing traders often approach VCPs.
Potential trigger
-
A breakout through the ~10.8–11.0 resistance zone
-
Preferably with expanding volume (or at least clear strength vs prior days)
Risk management (the whole point of VCP)
Because the pattern is tight, risk can be tight too. Common approaches:
-
Conservative: stop under the most recent tight pivot / last contraction low (below $10.25)
-
Slightly wider: stop under the broader support zone around the mid–9s
What to watch after the breakout
-
Does it hold above the breakout area? (breakouts that instantly fade are the ones to avoid/exit)
-
Does volume confirm? (it doesn’t have to be explosive, but you want evidence of demand)
-
Does it form a clean first pullback? (often the best “second chance” entry)
Why this is such a good example of ChartMill’s real value
This whole idea started with a fundamentals scan.
That’s important.
Because anyone can scroll charts until something “looks good.” The problem is that this process is:
-
time-consuming,
-
biased (you see what you want to see),
-
and often leads to low-quality names.
What happened here is the opposite:
-
Start with a strict fundamental filter (profitability + growth + valuation + health)
-
Reduce the universe to a tiny, high-quality shortlist
-
Let ChartMill’s Setup Quality surface the best technical opportunities
-
Then do the human part: read the chart, define the plan, manage the risk
That’s exactly why ChartMill is so powerful for swing traders:
it doesn’t just find “pretty charts”, it helps you find tradable charts inside a fundamentally strong universe.
And when you’re trying to build a repeatable process, that combination is gold.
The original shortlist (US stocks)
For completeness, here’s the same 16-stock US list from the X post:
- $LGCY, $HALO, $NVDA, $ENVA, $AU, $SVM, $PSIX, $HRMY, $CPRX, $HCI, $MU, $AGI, $NXT, $NBIX, $CDE, $VCTR
If you like this approach, you can take that list, save it as a personal screen and do the same thing (the results will change as the market continues to evolve):
- check Setup Quality,
- look for clean bases,
- and build a watchlist of “fundamentals + technicals” candidates.
Important: Great setups can still fail (nothing is certain)
Even the cleanest-looking VCP can fail. A tight base and a clear breakout level don’t guarantee follow-through, they just stack probabilities in your favor.
Common ways this kind of setup can go wrong:
-
False breakout: price pops above resistance, then quickly drops back into the range.
-
No demand: breakout happens, but volume/participation is weak and momentum dies out.
-
Market drag: the stock does “everything right,” but the broader market turns risk-off and pulls everything down.
-
Overhead supply: prior buyers use the breakout to exit, creating selling pressure just above the trigger.
That’s why swing trading is never about certainty, it’s about having:
-
a defined entry level,
-
a clear invalidation point (stop), and
-
the discipline to exit quickly when the thesis is wrong.
With VCP patterns, the upside is that risk is often well-defined. If the breakout fails, you typically want to know fast and be out fast.
Kristoff - ChartMill