
For investors aiming to assemble a portfolio of durable, high-achieving companies for the long term, the principles of quality investing offer a useful framework. This method centers on finding businesses with lasting competitive strengths, sound financial condition, and a confirmed capability to produce high returns on capital. One organized way to find these companies is the "Caviar Cruise" stock screen, which selects for firms displaying solid historical revenue and profit improvement, better profitability measures, dependable cash production, and a reasonable amount of debt. The screen highlights measurable features like a high Return on Invested Capital (ROIC), profit improvement greater than revenue improvement, and a dependable change of earnings into free cash flow.
A recent run of this screen found LINCOLN ELECTRIC HOLDINGS (NASDAQ:LECO) as a candidate deserving more examination. The Ohio-based maker of arc welding equipment, consumables, and cutting systems seems to display several important traits that quality investors value.
Matching the Main Quality Standards
The Caviar Cruise screen uses a set of strict financial filters, and Lincoln Electric’s operational record shows a good fit with these rules.
-
Lasting Improvement: The screen needs a minimum 5% compound annual growth rate (CAGR) for both revenue and EBIT (earnings before interest and taxes) over five years. Lincoln Electric easily meets both, with a revenue CAGR near 6.0% and a more notable EBIT CAGR of 11.6%. Importantly, the fact that EBIT improvement is faster than revenue improvement is a marker of a quality business. It shows better operational efficiency, pricing ability, or economies of scale, signs that the company is not only improving, but becoming more profitable as it does so.
-
Outstanding Capital Use: Maybe the most important measure for quality investors is Return on Invested Capital (ROIC), which calculates how well a company creates profits from its capital base. The screen requires an ROIC (leaving out cash, goodwill, and intangibles) over 15%. Lincoln Electric’s number of 34.4% is notable, showing a deeply established competitive edge and excellent management performance. A high ROIC implies the company can put its earnings back into the business at similarly high rates, supporting future improvement and building significant long-term shareholder value.
-
Financial Soundness and Cash Flow Dependability: The screen judges financial toughness by looking at the Debt-to-Free Cash Flow ratio (favoring a number under 5) and Profit Dependability (the 5-year average ratio of Free Cash Flow to Net Income, favoring above 75%). Lincoln Electric performs well here also.
- Its Debt/FCF ratio of 2.27 suggests it could pay off all its debt in just over two years using current cash flow, showing a very sound balance sheet.
- Its Profit Dependability score of 105.3% is excellent. This means the company has in the past changed more than 100% of its reported net income into actual free cash flow. This high-grade earnings ability gives the flexibility to pay for dividends, share repurchases, and strategic purchases without needing outside funding.
A Look at Foundational Condition
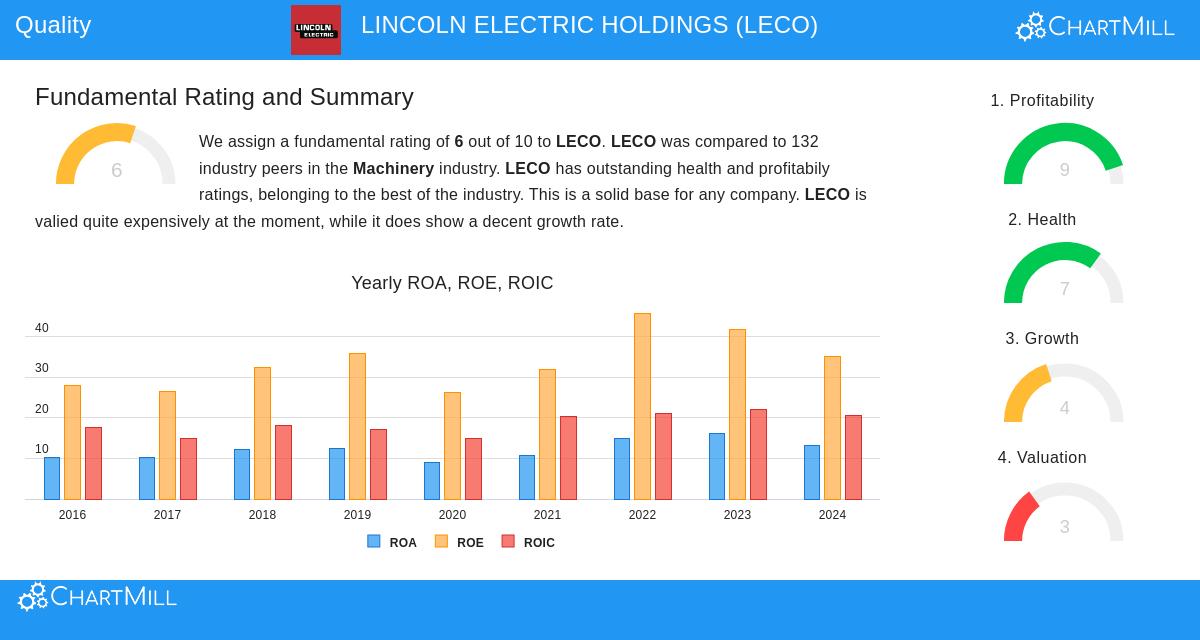
A look at Lincoln Electric’s wider foundational analysis report supports the image shown by the screen-specific measures. The company gets a good overall score of 6 out of 10, with its positive points clearly outweighing its negative points.
- Profitability is a High Point: With a score of 9/10, profitability is Lincoln Electric’s most solid area. It displays sector-leading margins and returns, including a 37.1% Return on Equity and a 20.2% ROIC, doing better than most of its machinery industry competitors. Both operating and profit margins have shown steady gains.
- Financial Condition is Sound: The company scores a 7/10 for financial condition. It gains from a very safe Altman-Z score and the solid Debt/FCF ratio mentioned earlier. While some liquidity measures are average, they are backed by excellent solvency and profitability.
- Improvement and Valuation Show Detail: The improvement score is neutral at 4/10, reflecting steady but not fast historical and expected future improvement in the mid-single digits. Valuation is the main area for care, scoring 3/10. The stock trades at a Price-to-Earnings ratio near 25.8, which is similar to the wider market and its sector but is seen as high on an absolute basis. For quality investors, this highlights the need for patience; the high price requires belief in the company's lasting competitive strength.
You can review the complete details of this foundational analysis here: Lincoln Electric Fundamental Report.
Why This Fits with Quality Investing
The Caviar Cruise method is made to find companies that are not only numerically sound but are also probable to have the non-numerical traits quality investors look for. Lincoln Electric’s results against the screen’s filters imply it may be this type of company. Its high and improving ROIC indicates a lasting competitive edge, likely coming from its solid brand, wide distribution network, and deep technical knowledge in welding. The capability to grow profits quicker than sales and produce ample free cash flow shows pricing ability and operational skill. A careful balance sheet with little debt compared to cash flow provides toughness against economic slowdowns, a key factor for a business connected to industrial cycles.
Finding More Quality Candidates
Lincoln Electric acts as a leading example of the kind of company the Caviar Cruise screen tries to find. For investors wanting to do their own study, the screen can be a useful beginning point for making a watchlist of quality candidates.
You can see the present results and change the settings of the Caviar Cruise screen yourself here: Caviar Cruise Stock Screen.
Disclaimer: This article is for informational purposes only and does not constitute financial advice, a recommendation, or an offer to buy or sell any security. The analysis is based on data and a predefined screening methodology. Investors should conduct their own due diligence and consider their individual financial circumstances and risk tolerance before making any investment decisions.