
Technical breakout setups are a common method for traders aiming to profit from stocks with strong momentum and consolidation patterns. The strategy focuses on spotting stocks with solid technical conditions, measured by tools like relative strength, moving averages, and trend consistency, while also finding the best entry points based on narrow trading ranges and support levels. KT CORP-SP ADR (NYSE:KT) has appeared as a candidate in this screening process, showing both a high technical score and a strong setup quality, positioning it as a possible breakout candidate.
Technical Strength of KT Corp
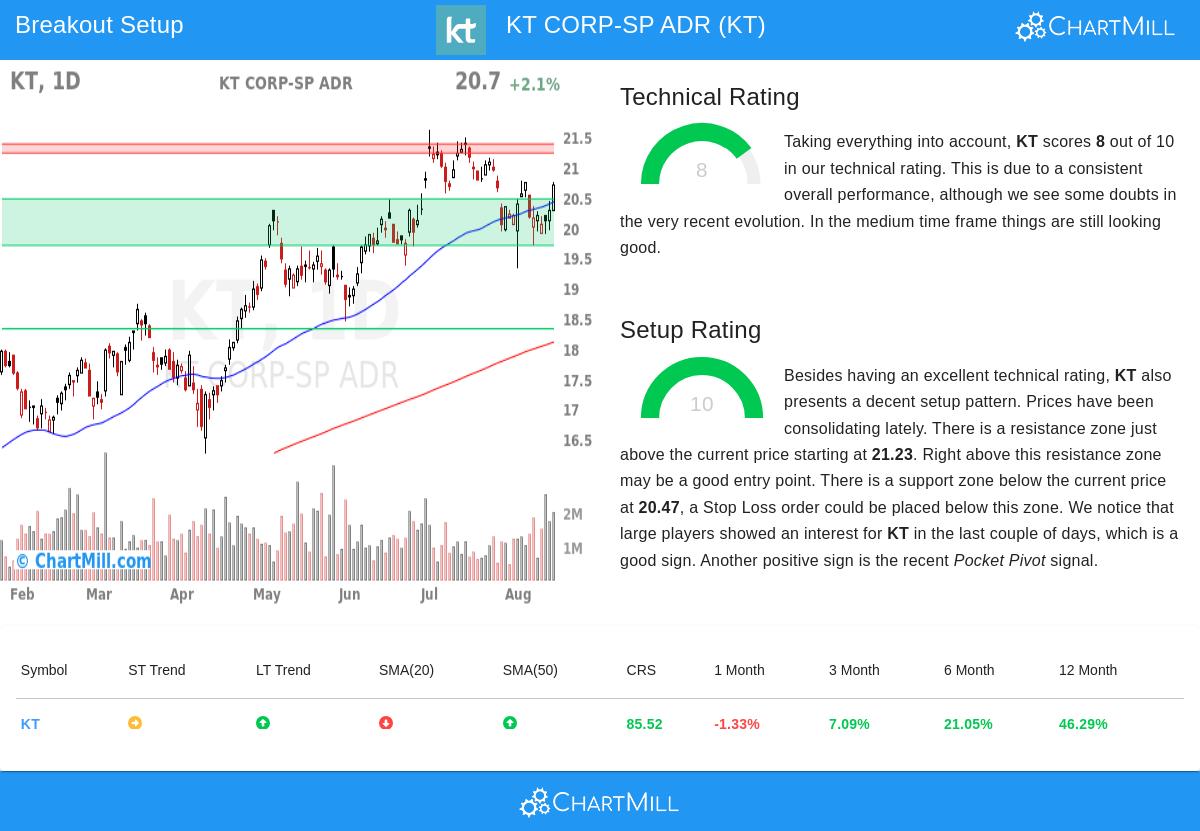
KT Corp’s technical score of 8 out of 10 highlights a steady upward trend, backed by several important factors:
- Long-Term Uptrend: The stock holds a positive long-term trend, with its price staying above key moving averages (50-day, 100-day, and 200-day SMAs), signaling continued bullish momentum.
- Relative Strength: KT performs better than 85% of all stocks over the past year, showing steady growth rather than temporary jumps. It also ranks well in the Diversified Telecommunication Services industry, outperforming 79% of competitors.
- Volume and Liquidity: Average daily trading volume of around 1.19 million shares provides enough liquidity, a key factor for breakout traders to minimize slippage.
While the short-term trend is neutral, the overall technical outlook stays positive, suggesting that any consolidation is more likely a pause before further gains rather than a sign of reversal.
Setup Quality and Breakout Potential
KT’s setup score of 10, the highest possible, points to an ideal consolidation pattern, often a sign of an upcoming breakout. Key details include:
- Narrow Trading Range: Over the past month, KT has traded between $19.32 and $21.15, with recent price action staying near the middle of this range. This tight range often comes before a significant move.
- Support and Resistance Levels:
- A clear resistance area sits at $21.23–$21.38. A move above this level could lead to further gains.
- Strong support lies between $19.70 and $20.47, supported by multiple moving averages and trendlines, offering a logical stop-loss zone.
- Institutional Interest: Recent accumulation signals, including a "Pocket Pivot"—a bullish volume/price pattern—hint that larger investors are buying the stock, adding confidence to the setup.
The mix of a high technical score and a near-perfect setup score fits the breakout strategy’s main idea: strong stocks in consolidation are ready for their next upward move.
Trade Considerations
The technical report suggests a possible entry above $21.39 (just above resistance) with a stop-loss below $19.31 (near key support). This creates a clear risk-reward profile, with the stop-loss representing about a 9.7% downside from the entry point. Traders with a 1% portfolio risk tolerance could allocate roughly 10.3% of capital to this setup.
Finding More Breakout Candidates
KT Corp is just one of many stocks currently showing strong technicals and setup quality. For traders looking for more opportunities, the Technical Breakout Setups screen offers an updated list of high-probability setups daily.
Disclaimer: This analysis is for informational purposes only and should not be seen as investment advice. Always do your own research and consider risk management strategies before trading.