
The search for high-growth stocks often involves a blend of technical and fundamental analysis, aiming to identify companies with strong momentum and accelerating business performance. One systematic approach to this is combining Mark Minervini's Trend Template with a focus on high-growth fundamentals. The Trend Template provides a strict technical checklist to ensure a stock is in a confirmed, strong uptrend, while a high-growth screen filters for companies showing exceptional earnings and sales momentum. This two-part method looks for leaders that are not only technically healthy but also fundamentally set for continued growth.
Kiniksa Pharmaceuticals International Plc (NASDAQ:KNSA) stands out as a candidate that matches this combined strategy. The biopharmaceutical company, with its commercial-stage portfolio including ARCALYST for recurrent pericarditis, seems to be showing the kind of strong price and fundamental performance that growth investors look for.
Meeting the Minervini Trend Template
Mark Minervini's Trend Template is made to filter for stocks in a dominant Stage 2 uptrend, avoiding poor performers and concentrating on market leaders. KNSA's chart and technical data indicate it satisfies these strict criteria, which are important for reducing risk and taking part in established upward momentum.
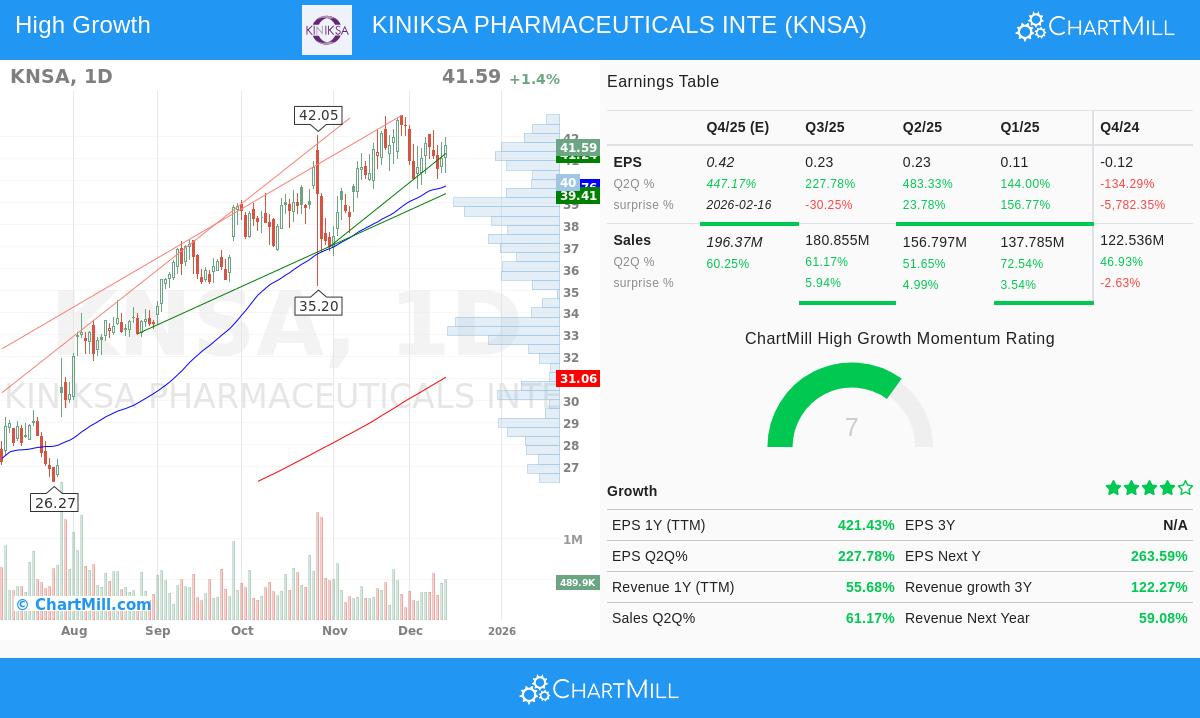
- Price Above Key Moving Averages: The stock's last price of $41.59 trades well above its rising 50-day ($39.76), 150-day ($33.92), and 200-day ($31.06) simple moving averages (SMAs). This alignment confirms sustained buying pressure across all major timeframes.
- Moving Average Alignment: The 50-day SMA is above both the 150-day and 200-day SMAs, and the 150-day SMA is above the 200-day SMA. This "stacked" order of shorter-term averages above longer-term ones is a classic sign of a strong, healthy trend.
- Proximity to Highs: KNSA is trading within 4% of its 52-week high of $42.98, meeting the template's requirement to be within 25% of the high. At the same time, the current price is over 130% above its 52-week low of $17.82, far exceeding the 30% threshold. This shows the stock has significant momentum behind it and is not a low-priced stock coming from a deep decline, but a strong performer.
- Superior Relative Strength: With a ChartMill Relative Strength (CRS) score of 94.16, KNSA is doing better than approximately 94% of all stocks in the market over the past year. High relative strength is a central part of the Minervini philosophy, as it finds sector and market leaders that often lead rallies.
Fundamentals for High Growth Momentum
While the Trend Template ensures a technically healthy setup, the "High Growth Momentum" part of the screen examines the company's operational performance. For a stock to maintain a strong trend, it usually needs the support of accelerating financial results. KNSA's fundamental metrics show several areas of very high growth.
- Earnings Acceleration: The company has shown notable earnings per share (EPS) growth. Quarterly EPS growth year-over-year is 227.8%, and the previous quarter saw an increase of 483.3%. This acceleration is a key indicator that positive business developments are being seen in profitability.
- Strong Sales Growth: Revenue growth is also notable, with the last quarter up 61.2% year-over-year. This top-line growth provides a firm base for the bottom-line gains and indicates good commercial execution for its products.
- Analyst Confidence: Possibly one of the most telling signs for future growth is analyst sentiment. The average estimate for next year's EPS has been adjusted upward by 130.7% over the last three months. Such a large upward adjustment shows that analysts are greatly increasing their expectations for the company's future profitability, often a signal of continued institutional buying interest.
- Positive Estimate Surprises: The company has exceeded revenue estimates in three of the last four quarters, building trust with the investment community. While EPS beats have been mixed, the overall trend in adjustments suggests analysts are adjusting to the company's improved path.
Technical Health and Setup
Beyond the basic criteria of the Trend Template, a closer look at KNSA's technical health supports the positive view. According to ChartMill's own analysis, the stock is in very good technical condition.
The system gives KNSA a top-level Technical Rating of 10 out of 10, showing very good technical health across multiple measures. The long-term trend is rated as positive, and the stock does better than 94% of the market and 79% of its biotechnology peers. Also, it shows a good Setup Rating of 8, suggesting the stock is in a consolidation phase within its uptrend, which could provide a defined entry point. The analysis finds nearby support and resistance areas, giving clear levels for possible stop-loss placement and breakout entries.
A detailed breakdown of the support, resistance, and a sample trade setup can be found in the full ChartMill Technical Report for KNSA.
A Candidate for Further Analysis
Kiniksa Pharmaceuticals presents a strong example of a stock that fits a disciplined growth and momentum strategy. It meets the strict technical filters of the Minervini Trend Template, confirming its position as a market leader in a strong uptrend. Fundamentally, it displays the kind of very high earnings growth, sales momentum, and rising analyst adjustments that high-growth investors seek. The combination indicates the stock's recent performance may be supported by real business success rather than speculation alone.
For investors interested in finding similar candidates that mix strong trends with high-growth fundamentals, this High Growth Momentum + Trend Template screen can serve as a beginning for more research.
Disclaimer: This article is for informational and educational purposes only. It is not a recommendation to buy or sell any security. The analysis is based on data provided and certain methodologies, and past performance is no guarantee of future results. Always conduct your own due diligence, consider your financial situation and risk tolerance, and consult with a qualified financial advisor before making any investment decisions. Please read our full disclaimer here.