
For investors who use technical analysis to find possible trades, a common method looks for stocks that are both technically solid and ready for a move soon. This usually means searching for equities in a clear, steady uptrend that are now in a period of sideways movement, giving a specific entry point with controlled risk. One organized way to do this is using specialized ratings like the ChartMill Technical Rating and Setup Quality Score. The Technical Rating, a number from 0 to 10, measures the general condition and trend force of a stock. The separate Setup Quality Score, also from 0 to 10, judges the condition of the present chart pattern, searching for signals of sideways movement that might come before a breakout. By selecting for stocks with good numbers in both areas, traders try to find chances where a technically good asset is preparing for its next upward move.
A recent search using this system has pointed to Kinross Gold Corp (NYSE:KGC) as a candidate showing these traits. The gold miner's technical condition and present chart pattern indicate it could be noteworthy for investors searching for breakout patterns in a market where the wider S&P 500 is also moving upward.
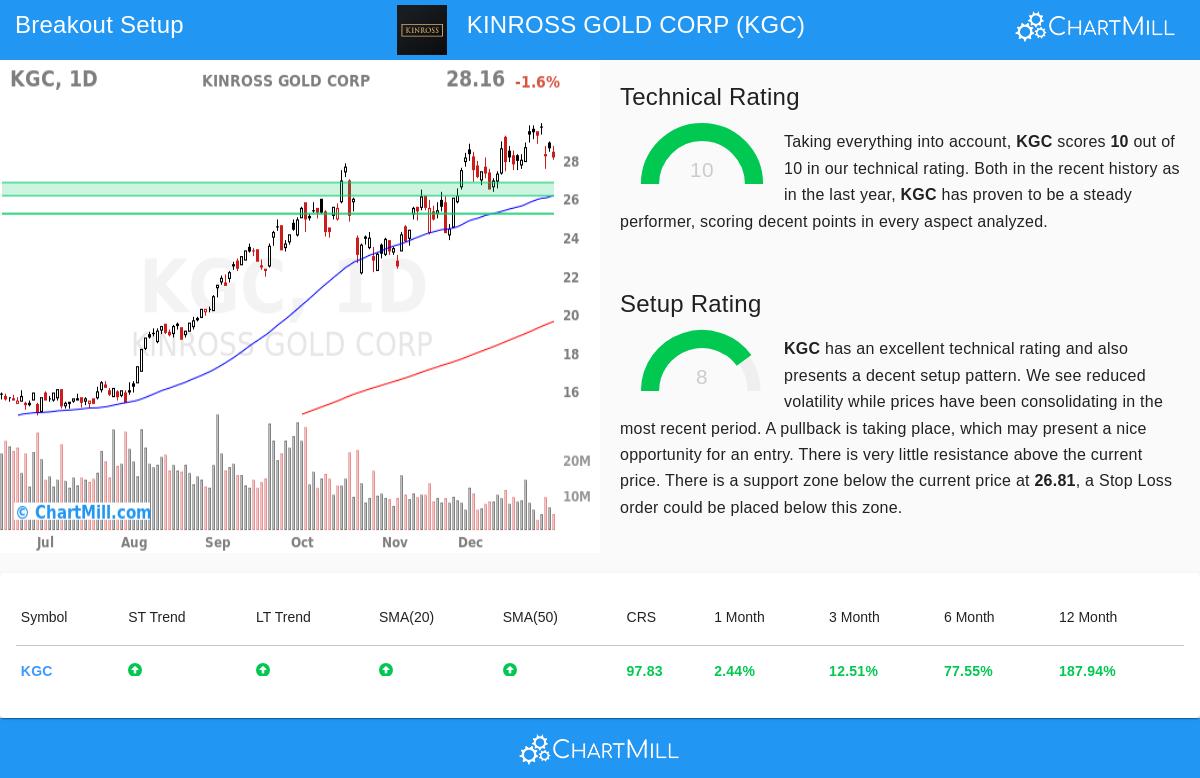
Technical Force: A High-Level Rating
The base of a breakout method is a stock's basic technical condition; there is little reason to anticipate a breakout from a stock in a downward trend. Kinross Gold receives a top ChartMill Technical Rating of 10, putting it with the market's best from a trend viewpoint. This high score comes from a number of combined good elements listed in its full technical report.
- Trend Agreement: Both the near-term and longer-term trends for KGC are marked as good, a strong mix that shows continued buying interest across various time frames.
- Solid Relative Performance: The stock is doing better than 97% of all stocks in the market over the last year, and its increases have been steady instead of caused by one jump. In its own Metals & Mining sector, it does better than 76% of similar companies.
- Moving Average Backing: The stock's price is above all its important simple moving averages (20, 50, 100, and 200-day), and each of these averages is itself in an upward arrangement. This layered agreement of support levels is a typical sign of a solid uptrend.
- Nearness to Highs: KGC is now trading close to its 52-week high of $29.90, confirming the force of its upward movement.
This solid technical foundation is exactly what the breakout search system looks for initially. A good Technical Rating makes sure the stock has the movement and market position to possibly continue a new breakout move.
Setup Condition: Sideways Movement Before the Next Advance
While a solid trend is needed, it is not enough for a good entry. A stock that has risen sharply may be stretched and likely to fall back. The ChartMill Setup Quality Score deals with this by finding times of sideways movement or narrow trading ranges that give more distinct risk limits. Kinross Gold gets a Setup Rating of 8, showing a good pattern.
The analysis states that KGC has been trading in a band between $26.33 and $29.90 over the last month and is now placed in the middle of this range. This time of lower volatility and sideways action after a previous rise is the "consolidation" stage the setup score finds. It lets some of the nearer-term extremes be reduced and can form a base for the next rise.
Importantly, the technical report describes a clear support area just below the present price, from $26.13 to $26.81, made by a mix of trendlines and moving averages. The existence of this specific support zone is a main part of a good setup, as it supplies a sensible level for setting a protective stop-loss order. With almost no close resistance noted above the present price, the way for a possible breakout seems clear.
An Example Trading Plan
Using these ratings, the technical report presents a possible trading plan. It suggests an entry point just above the 10-day moving average at $28.74, with a stop-loss order set below the noted support zone at $27.44. This would mean a risk of about 4.5% on the trade itself. It is important to know this is an example created from the analysis. Any trader should do their own study, change entry and exit points to fit their individual risk comfort, and always use stop-loss orders.
Finding Other Chances
The mix of a top Technical Rating and a good Setup Score makes Kinross Gold a clear example of the type of chance this search technique is made to find. For investors who want to see other stocks that now fit similar conditions, new possible breakout patterns are found each day.
You can see the present list of technical breakout candidates by going to the Technical Breakout Setups screen.
Disclaimer: This article is for information only and is not investment advice, a suggestion, or an offer or request to buy or sell any securities. The analysis uses technical measures and past data, which are not promises of future results. All trading and investment choices include risk, including the possible loss of original funds. Readers should do their own investigation and talk with a qualified financial advisor before making any investment choices.