
Technical investors often look for stocks showing both good momentum and consolidation patterns that indicate possible breakouts. One organized method uses filters to find securities with high technical ratings, pointing to good price trends, mixed with high setup quality scores that show tight trading ranges and specific risk levels. This process works to find equities set for further gains while providing specific entry and exit points built on technical levels.
KINROSS GOLD CORP (NYSE:KGC) offers a strong example for this method, getting full scores on important technical measures. The gold mining company's technical picture shows very good health over several periods, while recent price movement indicates the stock could be getting ready for its next notable move.
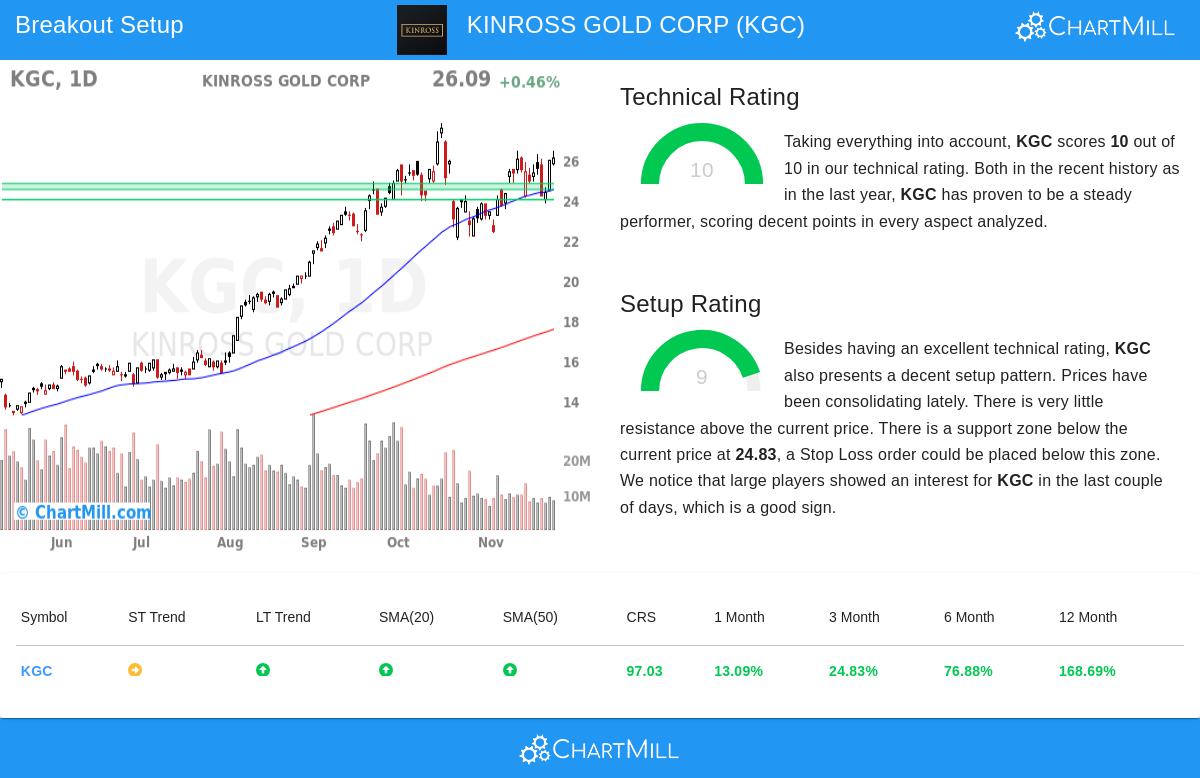
Technical Strength Assessment
Kinross Gold shows very good technical health, receiving a top rating of 10 in ChartMill's own evaluation system. This full score shows better performance over many technical areas that are important for finding market leaders. The technical rating looks at items such as relative strength, trend quality, and moving average agreement, all of which help in judging a stock's momentum features.
Important technical points from the detailed analysis report are:
- Very good relative strength, doing better than 97% of all stocks during the last year
- Positive long-term trend with steady gains spread over the time
- Good industry placement, beating 82% of metals and mining companies
- Trading close to 52-week highs along with general market health
- All main moving averages (20, 50, 100, and 200-day) moving up
The mix of these items forms a technically sound base that fits the method's need for stocks showing continued momentum. The steady performance over different periods lowers the chance of quick trend changes, giving a stable starting point for possible breakout moves.
Setup Quality and Consolidation Pattern
Besides technical strength, Kinross shows very good setup features with a setup quality rating of 9. This high score means the stock has been trading in a consolidation pattern, forming the situation for a possible breakout. The setup rating judges how closely prices have been trading lately, the nearness to moving averages, and the existence of specific support areas - all important for setting risk management rules.
Recent trading activity shows:
- Prices have moved within a $22.36 to $26.49 band over the last month
- Current placement near the top edge of this band
- Several set support levels between $24.53 and $24.83
- Lowered volatility during the consolidation time
- Notable institutional buying found through volume study
The setup indicates a possible entry point at $26.50, just above recent resistance, with a stop loss placed below the found support area at $24.52. This forms specific risk levels of about 7.5%, allowing for exact position sizing based on personal risk acceptance.
Market Context and Risk Considerations
While Kinross shows strong technical points, investors should think about several items before acting on this setup. The gold mining field stays reactive to commodity price changes and currency moves, especially with Kinross's worldwide work across North America, South America, and Africa. Recent volume patterns show some weakening, which might mean lower momentum, though this frequently happens during consolidation times.
The present market situation gives a mixed setting, with the S&P500 showing positive short-term trends but neutral longer-term momentum. Gold equities often show different features than wider markets, offering possible diversification benefits but also needing field-specific study.
Finding Additional Opportunities
The method that found Kinross Gold can be used to locate other possible breakout candidates. Investors curious about finding similar setups across different fields and market sizes can use the live screening tool via the Technical Breakout Setups screener. This resource updates daily with new candidates meeting the two needs of strong technical ratings and high setup quality scores.
Disclaimer: This analysis is built on technical indicators and historical price patterns and should not be taken as investment advice. Always do your own research, think about your risk acceptance, and talk with a financial advisor before making investment decisions. Past performance does not assure future results, and all investments carry risk of loss.