
Kinross Gold Corp (NYSE:KGC) stands out as a compelling candidate for investors following Mark Minervini’s trend-following strategy while also meeting high-growth momentum criteria. The stock exhibits strong technical health and solid fundamental growth, making it an interesting opportunity for traders and investors alike.
Why KGC Fits the Minervini Trend Template
Mark Minervini’s Trend Template focuses on identifying stocks in strong uptrends with clear technical strength. KGC meets all key criteria:
-
Price Above Key Moving Averages:
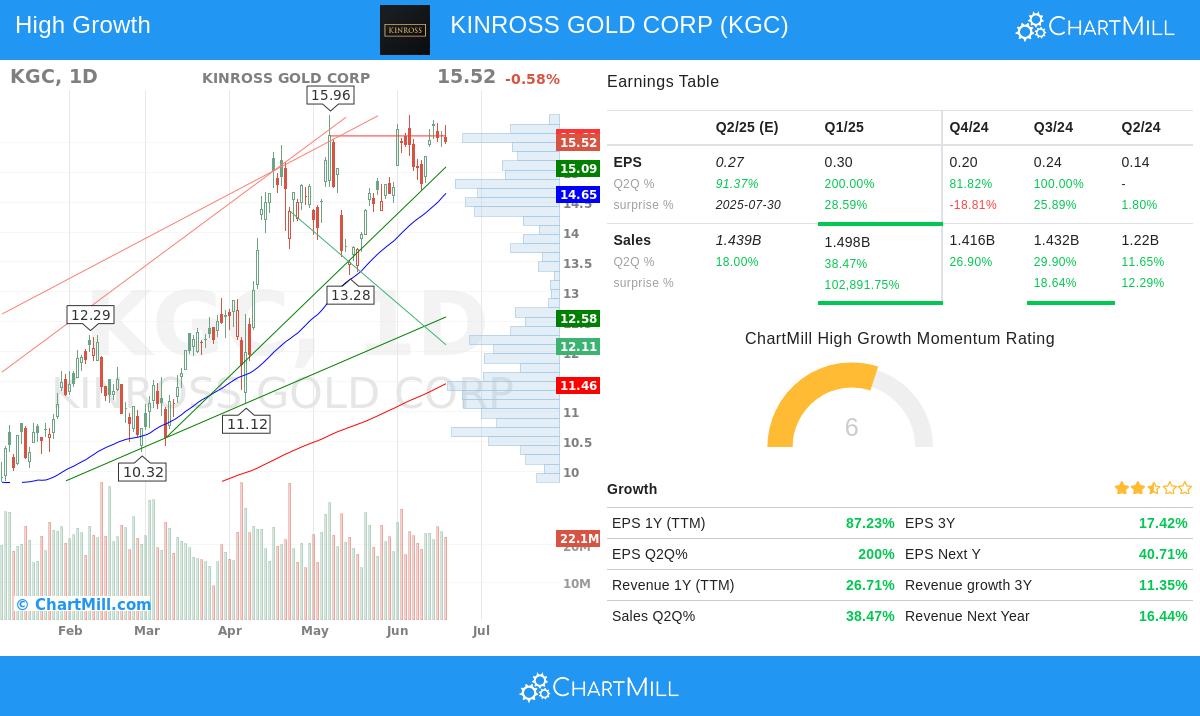
- Current price ($15.52) is above the 50-day ($14.65), 150-day ($12.04), and 200-day ($11.46) moving averages.
- The 50-day MA is above both the 150-day and 200-day MAs, confirming bullish alignment.
-
Upward-Trending Moving Averages:
- The 150-day and 200-day MAs are rising, indicating sustained upward momentum.
-
Strong Relative Strength:
- KGC’s relative strength (RS) score of 95.82 means it outperforms nearly 96% of all stocks, a hallmark of market leadership.
-
Price Near 52-Week High:
- The stock is trading within 3% of its 52-week high ($15.96), showing strong momentum.
- It has also surged over 100% from its 52-week low ($7.52), reinforcing its uptrend.
High Growth Momentum Fundamentals
Beyond technical strength, KGC demonstrates robust earnings and revenue growth, key for high-growth investors:
-
Earnings Growth:
- EPS (TTM) grew 87.2% YoY, with the latest quarter showing a staggering 200% YoY increase.
- Full-year EPS growth was 54.2%, with analysts revising next year’s estimates upward by 14% in the last three months.
-
Revenue Expansion:
- Revenue (TTM) grew 26.7% YoY, with quarterly sales up 38.5%.
- Next-year revenue estimates have been revised upward by 8%, signaling confidence in continued growth.
-
Profitability Improvements:
- Profit margins expanded to 19.5% in the latest quarter, up from 9.8% a year ago.
- Free cash flow per share surged 170% YoY, reflecting strong operational efficiency.
Technical Outlook & Trade Setup
According to ChartMill’s technical analysis, KGC has a perfect 10/10 technical rating and a 9/10 setup score, indicating a strong consolidation phase before a potential breakout. Key observations:
-
Support & Resistance:
- Immediate support lies at $15.09–$15.37, with resistance near $15.61–$15.80.
- A breakout above $15.81 could signal further upside.
-
Volume & Institutional Interest:
- Trading volume remains healthy (~21.9M avg.), with signs of institutional accumulation.
Our High Growth Momentum + Trend Template screener lists more stocks with similar characteristics.
For a deeper technical breakdown, review the full technical report on KGC.
Disclaimer
This is not investment advice. Always conduct your own research and consider risk management before making any investment decisions.