
In growth investing, joining a solid technical system with firm fundamental momentum can be an effective way to spot possible leading stocks. One organized technique for this is the combination of Mark Minervini's Trend Template with a High Growth Momentum (HGM) screen. The Trend Template gives a precise technical list to confirm a stock is in a definite, strong uptrend, concentrating on price movement, moving average order, and relative performance. The HGM rating then adds a fundamental screen, looking for firms displaying quickening earnings, sales increases, and positive estimate changes, the signs of possible top performers. This two-part method tries to locate stocks that are both technically firm and fundamentally set for ongoing growth.
JONES LANG LASALLE INC (NYSE:JLL) recently appeared from a screen constructed on this specific method. As a global provider of commercial real estate and investment management services, the firm's recent results indicate it may fit the standards wanted by momentum and growth-oriented investors.
A Firm Technical Base: Fitting the Minervini Trend Template
The center of Minervini's plan is to buy into strength, not guess on recovery tales. His Trend Template imposes discipline by demanding a stock to be in a clear, multi-timeframe uptrend before review. An inspection of JLL's chart and main measures shows it currently meets these strict technical requirements.
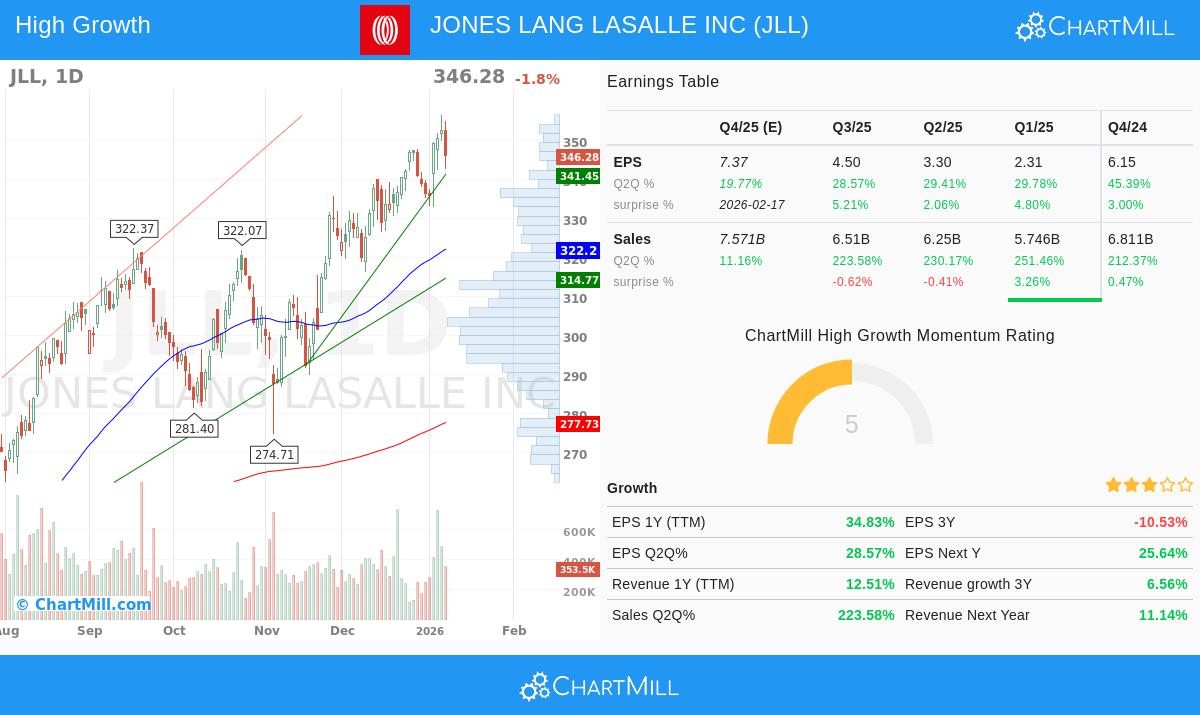
- Price Above Main Moving Averages: The stock's present price trades well above its 50-day ($322.20), 150-day ($294.54), and 200-day ($277.73) simple moving averages (SMAs). This order signals continued buying interest across short, medium, and long-term periods.
- Upward Moving Average Directions: Importantly, these moving averages are not just price points but are themselves moving higher. The increasing 200-day SMA, a key part of the template, verifies the long-term upward trend is present and sound.
- Best Moving Average Order: The quicker 50-day SMA sits above both the 150-day and 200-day SMAs, while the 150-day SMA is above the 200-day. This layered, rising sequence of averages is a standard mark of a solid Stage 2 rise, indicating gaining momentum.
- Nearness to Highs: JLL's price is within 3% of its 52-week high of $356.57, much better than the template's need to be within 25%. At the same time, the stock is almost 80% above its 52-week low, showing major recovery and power. Minervini's thinking stresses that stocks close to new highs frequently keep making new highs.
- Better Relative Performance: With a ChartMill Relative Strength (CRS) score of 88.37, JLL is doing better than almost 90% of all stocks in the market. High relative strength is essential in this plan, as it spots market leaders that usually draw institutional money and lead advances.
The Growth Driver: Passing on High Growth Momentum
While the Trend Template makes sure a stock is in the correct technical state, the High Growth Momentum rating examines the fundamental force that can push a stock forward. JLL's recent financial results show several good factors that growth investors look for.
- Solid and Quickening Earnings: The company's earnings per share (EPS) growth is firm and shows forward motion. Year-over-year EPS growth for the trailing twelve months is about 35%. More notably, the growth rate in recent quarters has been steadily high, with the last three quarters showing year-over-year gains of about 45%, 30%, and 29%, in turn. This sequence of high, successive growth is a main feature of rising leaders.
- Steady Earnings Beats: JLL has topped analyst EPS forecasts in each of the last four quarters, with an average beat of almost 3.8%. Steady positive beats often lead to higher changes in future forecasts and greater investor trust.
- Firm Revenue Growth: Top-line growth supplies the base for lasting earnings. JLL's revenue growth is sound, with the last reported full year showing almost 13% growth and recent quarterly numbers also in double digits. This signals demand for its services is rising.
- Gaining Profitability: A look at quarterly profit margins shows a good direction, moving from 0.96% two quarters ago to 3.42% in the latest quarter. Widening margins point to better operational efficiency and pricing ability, which can greatly increase earnings growth as revenue rises.
- Good Analyst Changes: Analysts have been lifting their forecasts, with the average EPS forecast for the next fiscal year changed upward by about 3.9% over the last three months. Upward changes are a strong fundamental driver, often coming before more price gains.
Technical Condition and Setup Review
ChartMill's own study gives a combined view of JLL's technical position. The stock gets a top-level Technical Rating of 10 out of 10, showing outstanding condition across both short and long-term periods. The report mentions the stock's steady performance and its place as one of the stronger performers in the market over the past year.
However, the Setup Quality Rating is a 7. This means that while the stock is technically very good, its recent price action has been a bit unstable, making the perfect, lower-risk entry point less obvious than in a tight sideways pattern. The study proposes waiting for a time of steadiness or a decline to a set support level might give a better risk/reward setup for new entries. You can see the complete, full technical analysis in the ChartMill Technical Report for JLL.
Locating Like Possibilities
JLL shows the kind of stock that can be found by mixing trend-following technical rules with fundamental growth screens. For investors wanting to use this method to find other possible choices, the preset screen that found JLL is ready to use. You can see more results from this 'High Growth Momentum + Trend Template' screen here.
Disclaimer: This article is for information and learning only. It is not meant as investment guidance, a suggestion, or a deal to buy or sell any security. The study is based on present data and methods, which can change. Buying stocks includes risk, including the possible loss of initial funds. You should do your own complete research and think about talking with a registered financial advisor before making any investment choices. Past results do not guarantee future outcomes.