
Our stock screening tool has pinpointed JANUS HENDERSON GROUP PLC (NYSE:JHG) as an undervalued stock. JHG maintains a solid financial footing. Furthermore, it remains attractively priced. Let's delve into the specifics below.
Assessing Valuation for JHG
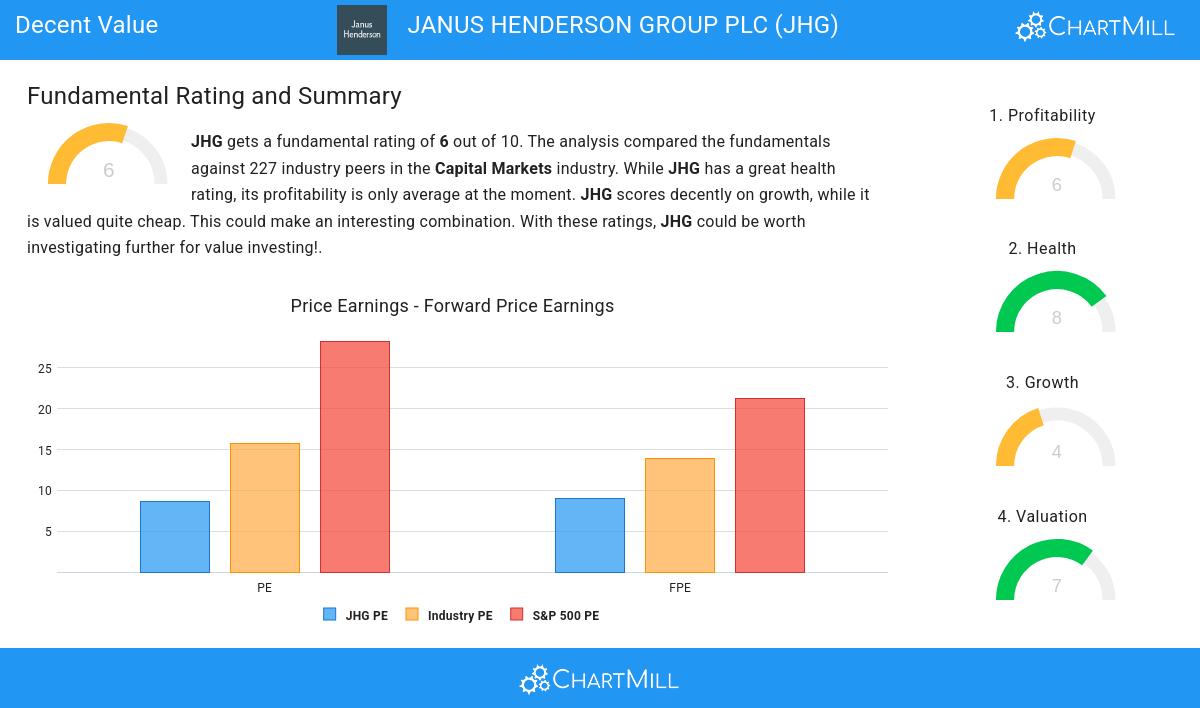
ChartMill assigns a Valuation Rating to each stock, ranging from 0 to 10. This rating is calculated by analyzing different valuation elements, such as price to earnings and free cash flow, both in absolute terms and relative to the market and industry. In the case of JHG, the assigned 7 reflects its valuation:
- Based on the Price/Earnings ratio of 8.68, the valuation of JHG can be described as reasonable.
- 74.89% of the companies in the same industry are more expensive than JHG, based on the Price/Earnings ratio.
- Compared to an average S&P500 Price/Earnings ratio of 28.29, JHG is valued rather cheaply.
- JHG is valuated reasonably with a Price/Forward Earnings ratio of 9.06.
- Based on the Price/Forward Earnings ratio, JHG is valued a bit cheaper than 71.37% of the companies in the same industry.
- JHG is valuated cheaply when we compare the Price/Forward Earnings ratio to 21.32, which is the current average of the S&P500 Index.
- Based on the Enterprise Value to EBITDA ratio, JHG is valued cheaply inside the industry as 97.80% of the companies are valued more expensively.
- Based on the Price/Free Cash Flow ratio, JHG is valued cheaper than 80.18% of the companies in the same industry.
- JHG has a very decent profitability rating, which may justify a higher PE ratio.
Profitability Examination for JHG
ChartMill's Profitability Rating offers a unique perspective on stock analysis, providing scores from 0 to 10. These ratings consider a wide range of profitability metrics and margins, both in comparison to industry peers and on their own merits. For JHG, the assigned 6 is a significant indicator of profitability:
- JHG has a Return On Assets of 7.56%. This is amongst the best in the industry. JHG outperforms 83.26% of its industry peers.
- JHG's Return On Equity of 11.47% is fine compared to the rest of the industry. JHG outperforms 60.79% of its industry peers.
- Looking at the Return On Invested Capital, with a value of 9.44%, JHG belongs to the top of the industry, outperforming 84.58% of the companies in the same industry.
- The 3 year average ROIC (7.17%) for JHG is below the current ROIC(9.44%), indicating increased profibility in the last year.
Health Insights: JHG
ChartMill assigns a proprietary Health Rating to each stock. The score is computed by evaluating various liquidity and solvency ratios and ranges from 0 to 10. JHG was assigned a score of 8 for health:
- JHG's Altman-Z score of 2.57 is fine compared to the rest of the industry. JHG outperforms 75.77% of its industry peers.
- The Debt to FCF ratio of JHG is 0.58, which is an excellent value as it means it would take JHG, only 0.58 years of fcf income to pay off all of its debts.
- With an excellent Debt to FCF ratio value of 0.58, JHG belongs to the best of the industry, outperforming 88.99% of the companies in the same industry.
- JHG has a Debt/Equity ratio of 0.09. This is a healthy value indicating a solid balance between debt and equity.
- JHG has a better Debt to Equity ratio (0.09) than 80.18% of its industry peers.
- A Current Ratio of 3.59 indicates that JHG has no problem at all paying its short term obligations.
- The Current ratio of JHG (3.59) is better than 83.26% of its industry peers.
- A Quick Ratio of 3.59 indicates that JHG has no problem at all paying its short term obligations.
- JHG has a Quick ratio of 3.59. This is amongst the best in the industry. JHG outperforms 83.26% of its industry peers.
How do we evaluate the Growth for JHG?
Every stock receives a Growth Rating from ChartMill, ranging from 0 to 10. This rating assesses various growth aspects, including historical and projected EPS and revenue growth. JHG boasts a 4 out of 10:
- JHG shows a strong growth in Earnings Per Share. In the last year, the EPS has been growing by 34.60%, which is quite impressive.
- The Revenue has grown by 42.34% in the past year. This is a very strong growth!
Every day, new Decent Value stocks can be found on ChartMill in our Decent Value screener.
Our latest full fundamental report of JHG contains the most current fundamental analsysis.
Keep in mind
Important Note: The content of this article is not intended as trading advice. It is essential to perform your own analysis and exercise caution when making trading decisions. The article presents observations created by automated analysis but does not guarantee any trading or investment outcomes. Always trade responsibly and make independent judgments.