
For investors looking to find possible trading chances, technical analysis offers a way to assess stocks using price action and market activity. One organized method uses unique ratings to find stocks that have both good technical condition and positive entry points. This process joins the ChartMill Technical Rating, which reviews a stock's total technical condition, with the Setup Quality Rating, which checks if the stock is making a consolidation shape that might come before a notable price change. Stocks with high marks in both areas often show interesting breakout patterns in stocks with good technicals.
Technical Strength Assessment
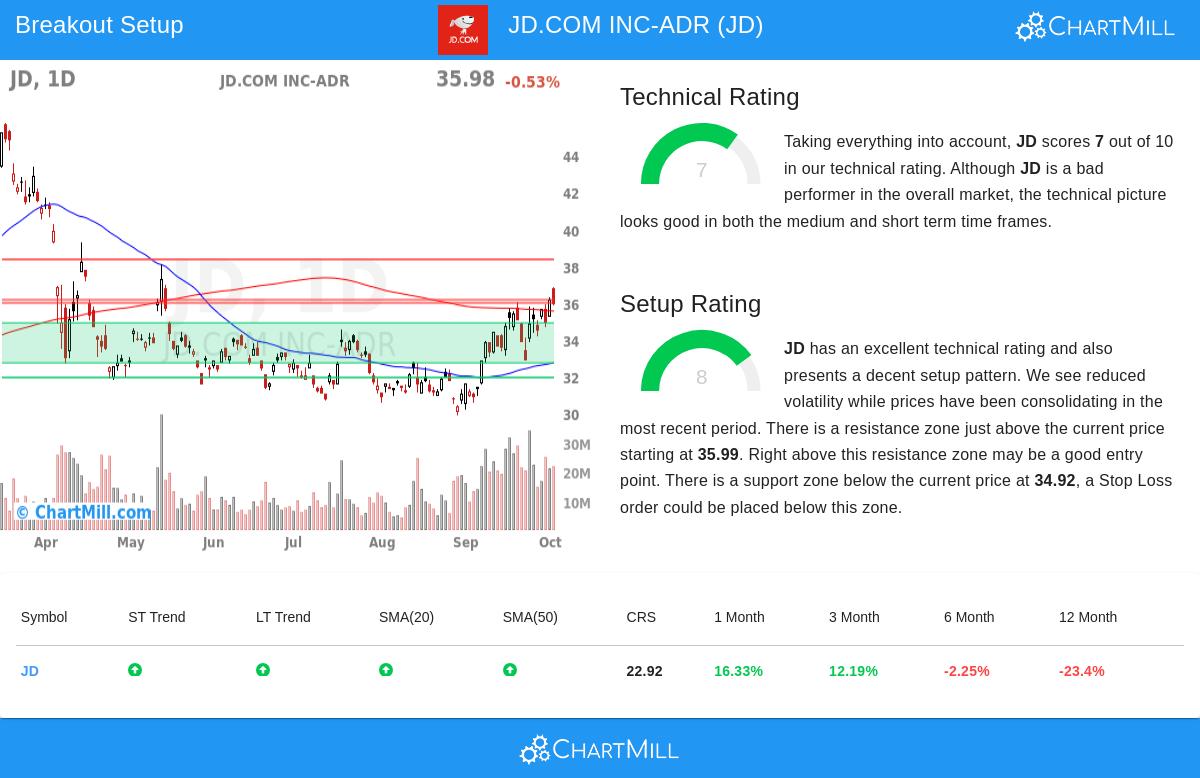
JD.COM INC-ADR (NASDAQ:JD) shows good technical basics as per the ChartMill Technical Rating system. The stock gets a technical rating of 7, putting it clearly in an uptrend based on this unique review structure. This mark shows several positive technical features that match the method's focus on finding stocks with existing upward momentum.
Important technical positives are:
- Both long-term and short-term trends are currently positive
- The stock is trading above its 20-day, 50-day, and 100-day moving averages, with all three moving upward
- Recent performance shows strong momentum with a 16.33% gain over the past month
- Trading volume remains healthy at about 15.5 million shares daily, giving good liquidity
These technical features are important within the breakout strategy structure because stocks with higher technical ratings usually show better momentum continuation. The method focuses on stocks scoring 7 or more on the technical rating scale to make sure they have the basic condition to possibly maintain breakout moves instead of having false breakouts that quickly turn around.
Setup Quality Evaluation
Besides technical condition, JD shows an appealing setup shape with a Setup Quality Rating of 8. This high mark means the stock has been moving within a set area while keeping its technical condition, making a situation that often comes before important price moves. The setup quality measure is key within this investment method because it helps find good entry points instead of just following stocks that have already had big moves.
The consolidation features include:
- The stock has been trading between $30.95 and $36.86 over the past month
- Several set support areas exist between $30.80 and $34.92
- A clear resistance area sits between $35.99 and $36.18
- Current price action shows the stock nearing this resistance level after a time of consolidation
This setup shape allows for clear risk limits, which is needed for the breakout strategy's risk control part. The method specifically looks for setups with ratings over 7 to find stocks that have consolidated enough to build force for a possible breakout while keeping enough pressure to offer positive risk-reward situations.
Trading Considerations
The technical analysis report indicates a possible breakout entry above $36.19, which would be a clear move past the noted resistance area. This level is important within the strategy because breakouts above consolidation resistance often mark the start of the next upward phase in stocks with good technicals. The proposed stop loss at $32.91 gives a set risk limit below the closest support area.
For investors wanting to look for similar chances, the Technical Breakout Setups screen often finds stocks meeting these technical and setup conditions. This screening tool automatically picks stocks with both good technical ratings and high-quality setup shapes, giving a beginning point for more review.
Disclaimer: This analysis is based on technical indicators and chart patterns and should not be considered investment advice. Always conduct your own research, consider your risk tolerance, and consult with a financial advisor before making investment decisions. Technical analysis does not guarantee future performance and should be used as one tool among many in the investment decision-making process.