
Johnson Controls International (NYSE:JCI) has appeared as a notable candidate from our technical breakout screening process. This method finds stocks displaying both good basic technical condition and price patterns that indicate possible breakout chances. The screening uses two specific measures: the ChartMill Technical Rating, which judges a stock's general technical condition, and the Setup Quality Rating, which examines the development of price patterns that frequently come before notable price changes. Stocks with high scores on both measures often represent companies with a good technical position set for possible upward price action.
Technical Strength Evaluation
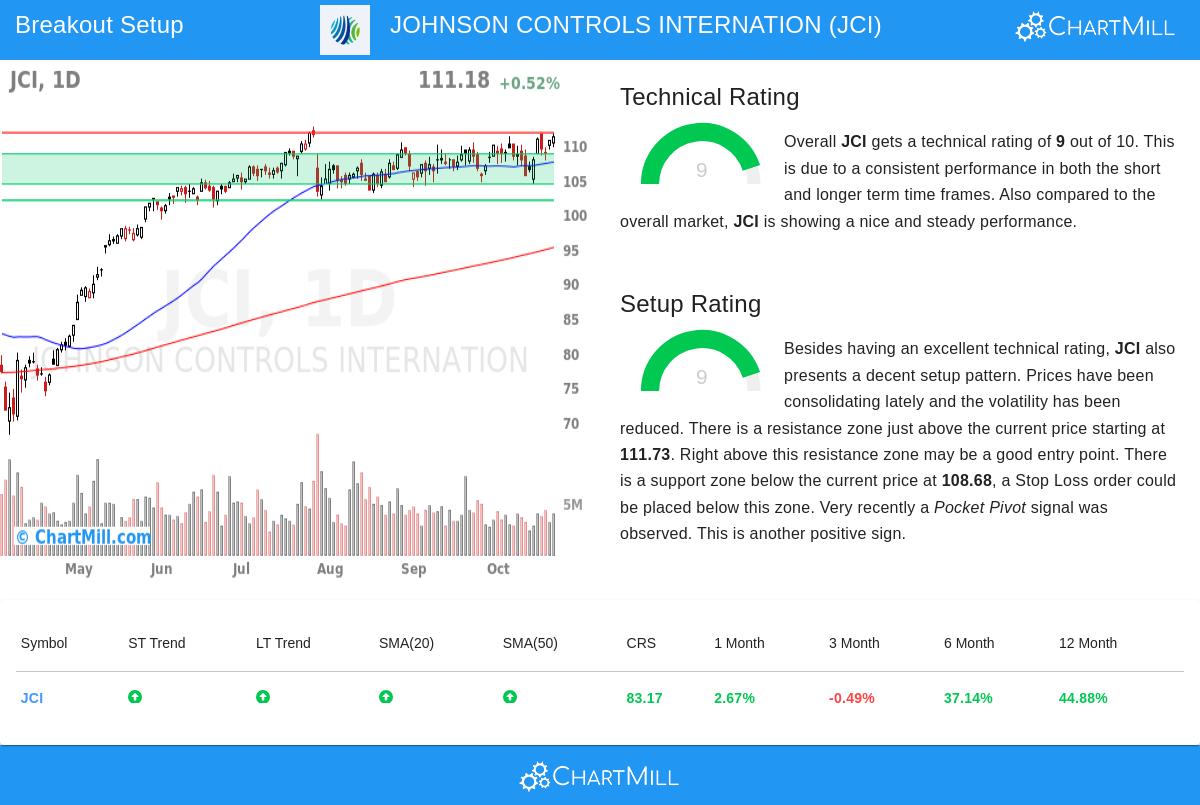
Johnson Controls shows very good technical condition, receiving a perfect 9 out of 10 Technical Rating in the detailed technical analysis report. This high rating shows several favorable technical elements that match our breakout screening requirements. The company's technical base stays strong across different time periods and market environments.
Important technical positives consist of:
- Both short-term and long-term price directions keeping upward movement
- Relative performance better than 83% of all stocks in the market
- Sector leadership in the Building Products industry, performing better than 92% of similar companies
- Steady trading above several moving averages (20-day, 50-day, 100-day, and 200-day)
- Present price level close to 52-week highs together with general market strength
The importance of these technical elements is in their combined signal of continued buying interest and institutional backing. Stocks with high Technical Ratings usually show steady upward movement and better performance compared to both the wider market and their industry counterparts, making them good possibilities for continuation patterns and effective breakouts.
Setup Quality and Price Pattern
In addition to its good technical base, Johnson Controls displays an appealing setup pattern with a Setup Quality Rating of 9. The stock has been trading in a specific range from $104.49 to $111.59 over the last month, with recent price movement displaying less volatility and a tightening pattern near the top of this range. This squeezing often comes before important directional price changes.
The setup displays several features that technical traders usually look for:
- Clear resistance area found at $111.73, created by multi-timeframe study
- Specific support area from $104.31 to $108.68, giving logical stop-loss areas
- Recent pocket pivot signal showing institutional buying
- Lowering volatility inside the price range
- Closeness to a possible breakout level with acceptable risk factors
These setup features are important because they give clear entry and exit points while controlling risk. The price pattern lets traders take positions with good risk-reward relationships, entering when the price moves above resistance while setting protective stops under confirmed support levels.
Trading Factors and Market Situation
In the present market situation where the S&P 500 keeps both short-term and long-term upward directions, Johnson Controls functions in a favorable environment. The building products industry has displayed stability, and JCI's status as an industry leader adds confidence to the technical setup. The stock's average daily volume of about 4.2 million shares provides sufficient liquidity for position entry and exit.
The automatically created trading setup indicates:
- Possible entry above resistance at $111.74
- Stop-loss placement under support at $104.48
- Risk of about 6.50% from entry to stop-loss
- Position size allowing for 15.39% capital use for 1% portfolio risk
Traders should be aware that while the technical setup looks attractive, personal risk comfort and trading method should determine final position size and stop-loss placement. The fairly close stop may work for short-term traders, while longer-term investors could think about wider stops to allow for normal price swings.
Find Other Possibilities
For investors looking for similar technical breakout chances, our Technical Breakout Setups screen constantly searches the market for stocks showing both good technical ratings and high-quality setup patterns. This organized method helps find possible trading candidates across different sectors and company sizes.
Disclaimer: This analysis is based on technical indicators and historical price patterns and should not be considered investment advice. Always conduct your own research, consider your risk tolerance, and consult with a financial advisor before making investment decisions. Past performance does not guarantee future results, and all trading involves risk including the possible loss of principal.