
Technical analysis investors often look for stocks displaying both good basic momentum and consolidation patterns that indicate possible breakouts. One methodical process uses filters to find securities with high technical ratings, which assess overall trend condition, paired with good setup quality scores that find times of price consolidation. This process helps identify stocks that are not only moving up but also set for possible continuation moves when they leave tight trading areas.
Invesco Ltd (NYSE:IVZ) is currently in such a setup, appearing in technical breakout filters with both ratings at 8 out of 10. The asset management firm, which offers investment management services in various asset classes and locations, displays features that match the breakout filter conditions.
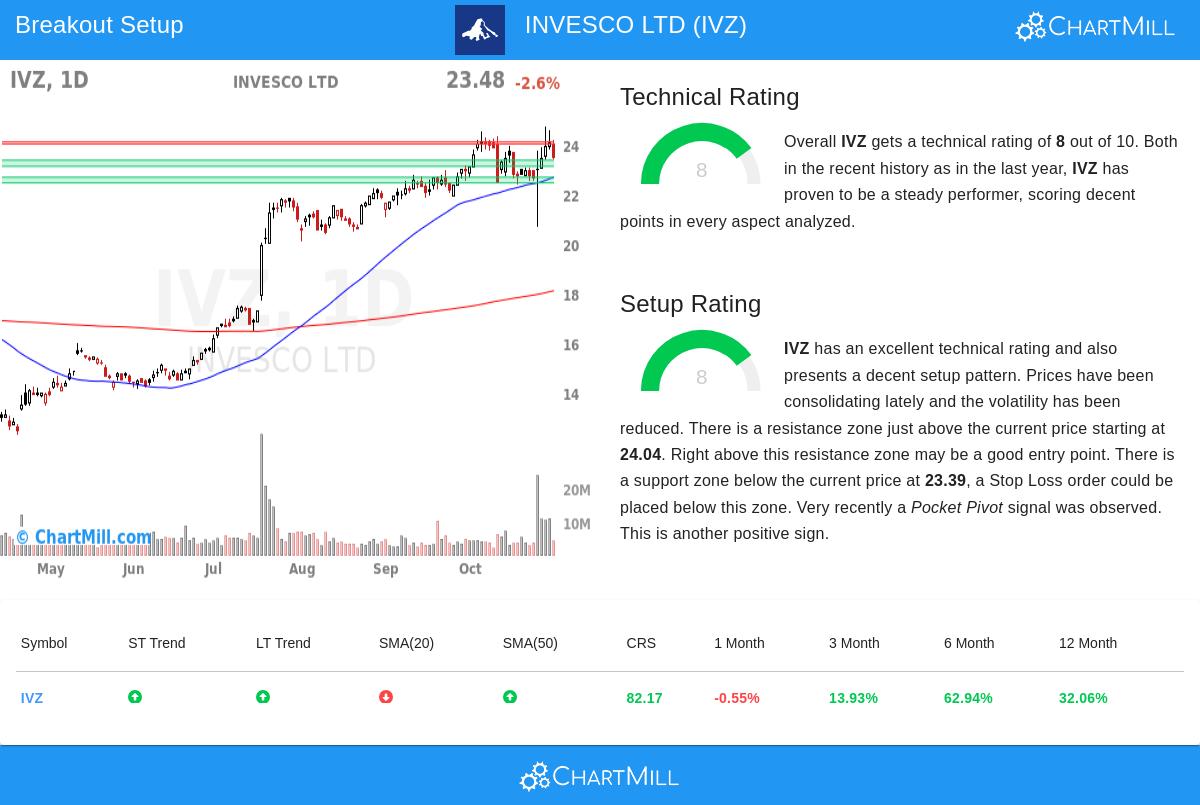
Technical Strength Review
The base of any breakout setup starts with verifying the stock's basic technical condition. IVZ shows good trend features across different time periods according to the technical analysis report. Both short-term and long-term trends are rated as positive, creating a good setting for continuation moves. The stock's location compared to important moving averages further supports this condition:
- Trading above the 20-day SMA (23.39), 50-day SMA (22.70), and 200-day SMA (18.10)
- Currently trading near its 52-week high of 24.75
- Performing better than 91% of stocks in the Capital Markets industry
- Displaying good relative strength compared to the wider market
These technical features add to the stock's good rating and give assurance that any breakout would happen within a confirmed uptrend rather than being just a counter-trend move.
Setup Quality Review
While technical strength finds trending stocks, the setup quality shows if suitable entry and risk management points are present. IVZ currently shows consolidation features that frequently come before notable price moves. The setup review shows several positive parts:
- Prices have been moving sideways lately within a set area
- Several support levels are present below the current price
- A clear resistance area between 24.04 and 24.13 gives a possible breakout point
- Recent pocket pivot signal showing institutional buying
The existence of set support and resistance levels creates a structure for using careful trade management. The automated review indicates a possible entry above 24.14 with a stop loss below 23.13, establishing set risk measures for position sizing.
Market Situation and Risk Factors
The wider market situation is favorable for technical breakout methods, with the S&P 500 showing positive trends in both short-term and long-term periods. However, investors should be aware that IVZ has shown significant price swings in recent months, trading between 20.67 and 24.75 over the last month. While the stock shows good technicals, the nearness to resistance and higher volume in recent trading sessions call for close watching of any breakout try for confirmation.
Traders using this method would usually place buy-stop orders above the noted resistance level, entering only if real breakout momentum appears. The several support levels below current prices give possible areas for stop-loss placement, although the somewhat close suggested stop distance of about 4% might need changes based on personal risk comfort.
For investors looking for more technical breakout possibilities, the Technical Breakout Setups screen gives daily updated results using similar conditions to find possible setups across the market.
Disclaimer: This review is based on technical indicators and automated filter results and should not be taken as investment advice. Always do your own research, think about your risk comfort, and talk with a financial advisor before making investment choices. Technical analysis does not assure future results and should be used as one part of a full investment method.