
Growth investing methods often look for firms showing solid earnings momentum, strong sales growth, and industry prominence. One organized way to pursue this investment style is the CANSLIM system, made well-known by William O'Neil. This approach mixes fundamental and technical review, searching for equities with rising quarterly earnings and sales (C & A), novel offerings or price peaks (N), positive supply and demand factors (S), leading position (L), institutional investment (I), and agreement with the overall market trend (M). The aim is to locate fast-growing industry frontrunners before their shares advance substantially.
A recent scan using main CANSLIM filters has identified IRSA Inversiones y Representaciones SA (NYSE:IRS) as a possible prospect. The Argentine real estate group, with activities in shopping centers, offices, hotels, and property construction, seems to fit many of the system's numerical standards.
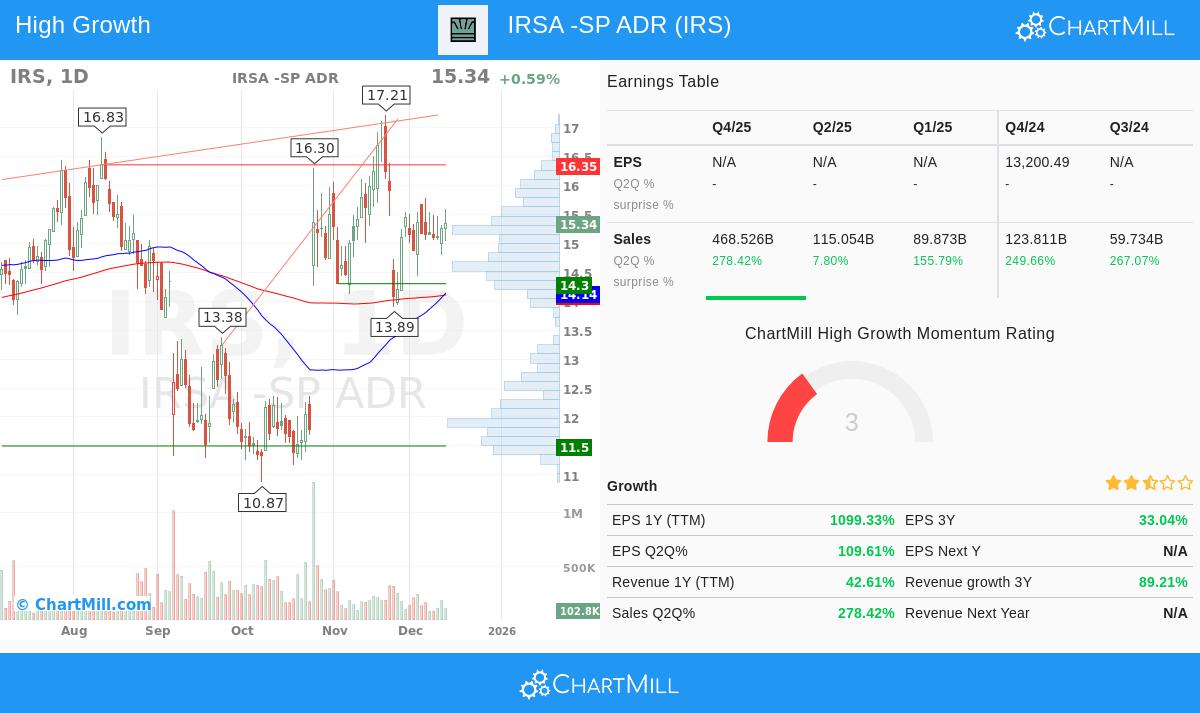
Reviewing the Fundamental "C" and "A" Factors
The "C" in CANSLIM stresses current quarterly earnings and sales per share increase, while the "A" looks at yearly earnings gains. IRS displays very strong recent performance that matches these points.
- Quarterly Earnings & Sales Growth: The firm announced a year-over-year earnings per share (EPS) increase of about 109.6% for its latest quarter. Even more notable is its quarterly sales growth, which jumped 278.4%. These numbers are well above the CANSLIM suggestion of at least 20-25% growth, signaling very strong current business momentum.
- Continued Yearly Growth: Examining a longer period, IRS has recorded a 3-year compounded annual EPS growth rate of 33.0%, clearly above the 25% level recommended by the method. This indicates the recent performance is not a single occurrence but part of a longer-running growth pattern.
- Profitability Measure: The system also considers high return on equity (ROE) a marker of effective use of investor funds. IRS's ROE of 12.4% is better than the usual 10% minimum and sits in the higher range of its real estate industry group.
These fundamental points are examined in the firm's full fundamental analysis report.
Technical and Market Stance: "L," "S," and "I"
The CANSLIM system does not rely only on fundamentals; it needs verification from how the market treats the stock.
- Market Position (L): A central idea is to invest in frontrunners, not weaker performers. IRS has a relative strength score of 75.3, meaning it has done better than about 75% of all equities in the market over the previous year. This puts it clearly in the market frontrunner group the method looks for.
- Supply, Demand, and Investment: The company holds a modest debt-to-equity ratio of 0.33, which is positive from a financial stability and "supply" angle. The "I" for institutional investment presents a mixed view: while the institutional ownership percentage is a modest 6.5%, which might mean potential for future institutional finding and purchasing activity, it is an aspect investors could watch for growing trends.
Technical View and Market Setting
The technical situation for IRS supports its fundamental screening. Based on its technical analysis report, the stock is in positive trends on both near-term and longer-term views, a state preferred by the "M" (Market Direction) part of CANSLIM, particularly as the wider S&P 500 also trends upward. The stock is changing hands in the higher part of its 52-week range and recently showed a period of sideways movement, which may occasionally come before a new upward move if the stock can move past nearby price barriers.
Summary of Reports
- Fundamental Analysis: The report gives IRS a score of 4 out of 10, noting very high profitability margins and very solid historical growth in EPS and revenue. It points out some issues related to financial stability and mentions high valuation compared to its sector. The absence of available future projections makes coming growth more difficult to assess.
- Technical Analysis: The technical score is a firmer 7 out of 10. The review notes the positive trends, solid relative performance inside its industry, and a reasonable chart formation with clear support and resistance prices.
A Prospect for More Study
Based on the particular CANSLIM filters used, including very large quarterly growth, solid yearly EPS growth, high ROE, market-leading relative strength, and low debt, IRSA Inversiones y Representaciones SA shows a profile that justifies more examination from growth-focused investors. It demonstrates the kind of firm the system tries to find: one with very strong fundamental momentum that is receiving market attention.
Investors wanting to examine other equities that meet similar CANSLIM-based filters can see the full screening results here.
Disclaimer: This article is for informational purposes only and does not constitute investment advice, a recommendation, or an offer or solicitation to buy or sell any securities. The analysis is based on data and methodologies believed to be reliable, but its accuracy cannot be guaranteed. Investors should conduct their own independent research and consult with a qualified financial advisor before making any investment decisions.