
The CAN SLIM investment methodology, created by William O'Neil, integrates fundamental and technical analysis to find high-growth stocks with solid momentum possibility. This structured method assesses companies using seven main factors represented by the acronym CAN SLIM, concentrating on earnings speed, yearly growth patterns, new products or services, supply-demand forces, market leadership, institutional backing, and the general market direction. Stocks satisfying these strict conditions usually show solid fundamental traits while also displaying technical firmness that indicates market acknowledgment of their growth possibility.
Recent Performance and Growth Measurements
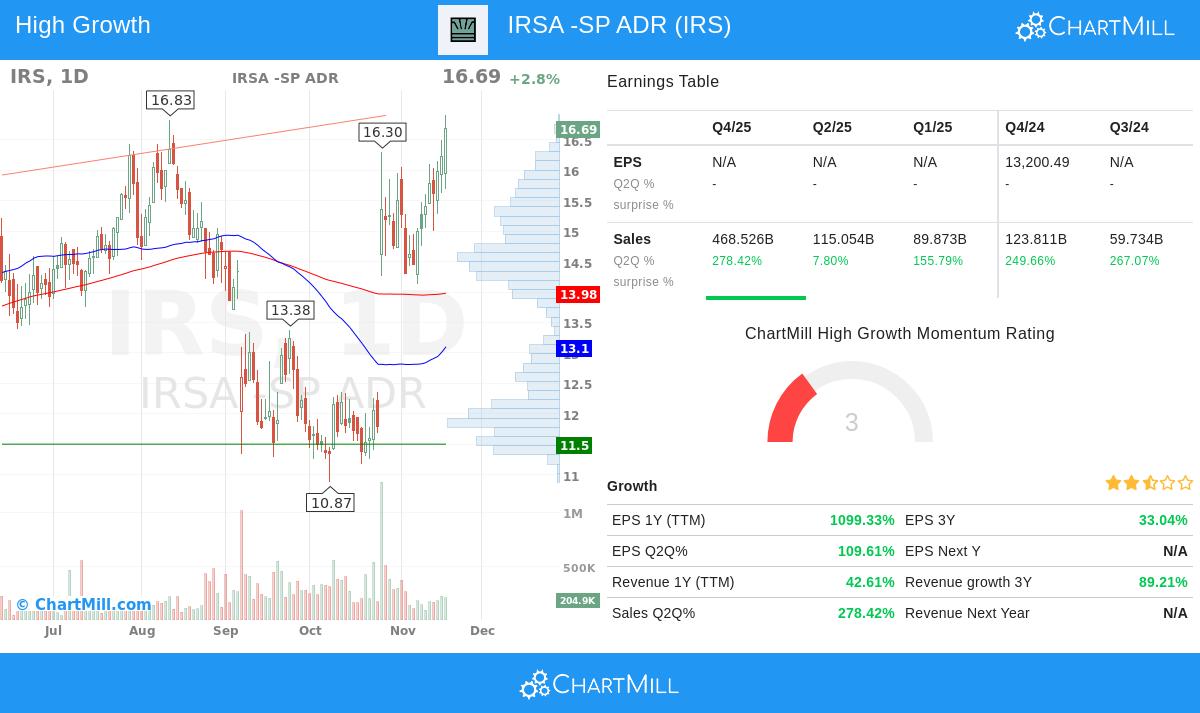
IRSA -SP ADR (NYSE:IRS) shows very good recent growth that fits exactly with the "C" part in CAN SLIM, which highlights current quarterly earnings and sales speed. The company's newest financial outcomes display notable momentum:
- Quarterly earnings per share growth of 1,099% year-over-year
- Quarterly revenue growth of 278% compared to the same quarter last year
- Three-year EPS compound annual growth rate of 33%
These very high growth numbers are well above O'Neil's suggested minimums of 20-25% for quarterly earnings growth and 25-50% for yearly rises. The speed increase in both earnings and revenue indicates the company is having solid operational momentum, a main element that CAN SLIM investors look for when finding possible market leaders.
Profitability and Financial Condition
The "A" in CAN SLIM looks at yearly earnings gains and general profitability, where IRSA displays good strong points. The company's return on equity of 12.37% puts it in the high group of its industry, doing better than 90% of similar companies in the real estate management and development field. This solid ROE shows efficient use of shareholder money, which is important for continued growth. Other profitability measurements include:
- Profit margin of 41.66%, placed in the top 2% of industry rivals
- Operating margin of 37.53%, higher than 95% of industry peers
- Gross margin of 60.78%, superior to 86% of comparable companies
While the company's fundamental rating of 4/10 shows some issues about financial condition, mainly connected to rising shares outstanding and increasing debt-to-assets ratio, its debt-to-equity ratio of 0.33 stays low and is better than 65% of industry competitors.
Technical Firmness and Market Standing
IRSA shows solid technical traits that meet several CAN SLIM conditions. The stock's relative strength of 77.61 means it is doing better than about 78% of all stocks in the market, meeting the "L" condition for leadership. This technical rating of 8/10 shows:
- Both short-term and long-term trends currently positive
- Trading in the upper part of its 52-week range
- Solid monthly performance of nearly 45%
The stock's present technical position, while displaying some price swings that could indicate waiting for a stable period, shows the market acknowledgment that CAN SLIM method highlights. The mix of solid relative strength and positive trend alignment points to institutional interest, though trading volume has lately gone down during the upward price move.
Institutional Backing and Supply Elements
With institutional ownership at only 7.46%, IRSA presents a notable profile for the "I" condition. While this low percentage could at first appear problematic, it actually shows considerable possibility for more institutional finding and purchasing pressure. The "S" condition about supply and demand is supported by the company's acceptable debt levels and the technical proof of purchasing interest during important price moves.
Market Situation and Risk Factors
The present market condition displays a positive short-term trend for the S&P 500 together with a negative long-term trend, creating a mixed setting for new investments. CAN SLIM users would observe that while IRSA's solid fundamental and technical traits are good, market direction ("M" condition) needs watchful tracking. The stock's recent unsteady price movement indicates possible buying chances might appear during times of price stability.
Detailed Study Resources
For investors looking for deeper study, full technical and fundamental reports are accessible. The technical analysis report gives detailed chart formations, support points, and trend study, while the fundamental analysis report provides wide financial ratio study and peer reviews.
Find More CAN SLIM Choices
IRSA stands for just one of the possible chances found through systematic CAN SLIM filtering. Investors curious about looking at more stocks that meet these strict growth and momentum conditions can use our pre-set CAN SLIM screener to see present matches and adjust filtering settings based on personal risk comfort and investment goals.
Disclaimer: This study is for information purposes only and does not make up investment guidance, a suggestion to purchase, sell, or hold any security, or a proposal to request any transaction in securities. Investors should do their own investigation and talk with a qualified financial consultant before making investment choices.