
Technical investors often look for stocks showing both good momentum and consolidation patterns that indicate possible breakouts. One method uses ChartMill's Technical Rating, which evaluates overall technical condition, with its Setup Quality Rating, which finds consolidation periods giving good entry points. Stocks with high scores on both measures usually represent technically good companies forming bases that might come before large price changes.
Technical Strength Evaluation
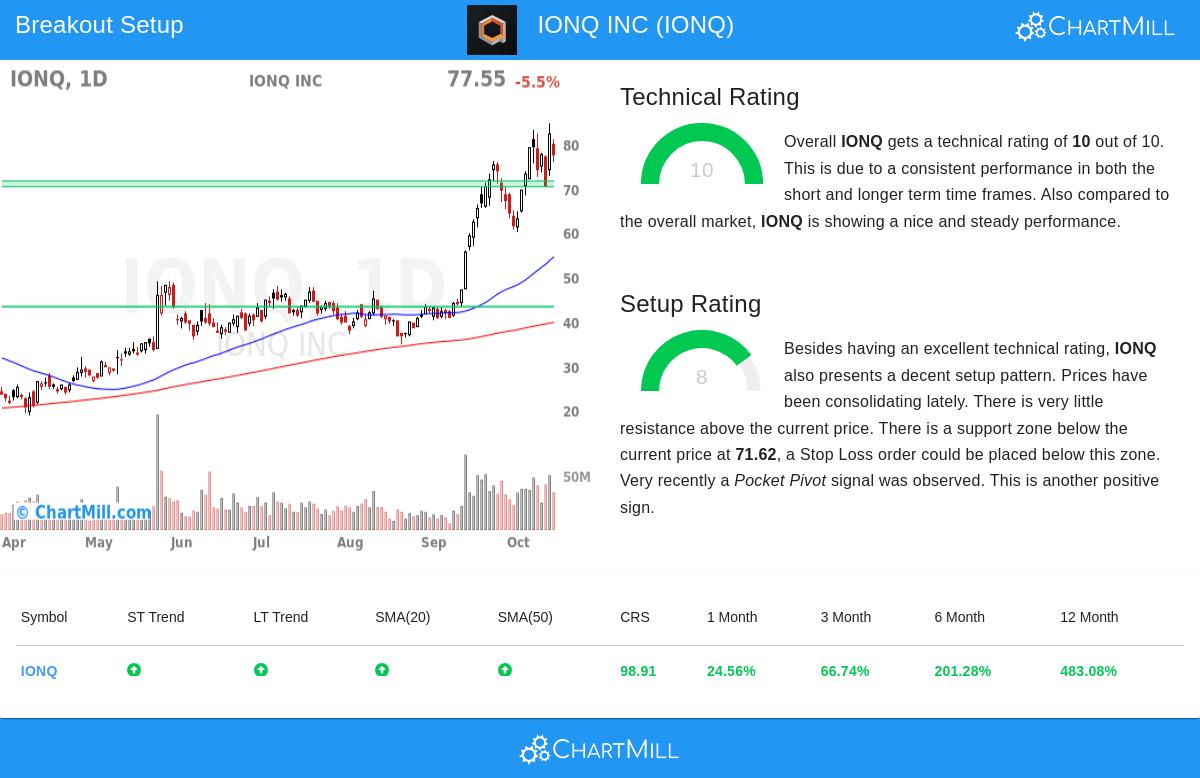
IonQ Inc (NYSE:IONQ) shows very good technical strength with a top Technical Rating of 10 out of 10. This high rating shows solid performance across different timeframes and technical measures. The stock keeps positive trends in both short-term and long-term views, a main feature looked for by momentum investors. A number of factors add to this high rating:
- The stock has done much better than 98% of all stocks over the last year
- It is in the top 7% within the Technology Hardware, Storage & Peripherals industry
- All main moving averages (20-day to 200-day) are moving up
- Current trading near 52-week highs confirms continuing bullish momentum
This full technical strength matches well with the breakout strategy's need for stocks with clear upward paths. Stocks with high Technical Ratings often show steady relative strength and clear trends, making them good choices for continuation patterns.
Setup Quality Evaluation
Along with its technical quality, IonQ shows an interesting setup pattern with a Setup Rating of 8 out of 10. This means the stock has been moving within a set range, creating conditions good for a possible breakout. The setup evaluation shows several positive features:
- Prices have been trading between $60.14 and $84.64 over the last month
- A clear support area exists between $70.33 and $71.62, giving a sensible level for stop-loss placement
- Little overhead resistance suggests space for upward movement
- Recent pocket pivot signal points to institutional buying
The consolidation pattern lets technical traders find exact entry and exit points, an important part of risk management in breakout trading. The current setup suggests an entry above $84.65 with a stop-loss below the support area at $70.32, representing managed risk parameters for position sizing.
Market Situation and Volume Factors
While the S&P 500 shows a positive short-term trend next to a neutral long-term view, IonQ has shown very good independent strength. Volume patterns show more activity in recent sessions, with average daily volume of about 26.9 million shares giving enough liquidity. The stock's Average True Range of 8.21% shows meaningful daily price movement, giving chances for swing traders while needing suitable position sizing to handle volatility.
In-Depth Technical Report
For investors looking for full technical analysis, the complete ChartMill technical report for IonQ gives more detailed looks into support and resistance levels, trend evaluation, and other proprietary indicators that add to the stock's ratings.
Finding Other Opportunities
Technical breakout setups like IonQ's can be found daily through methodical screening. The Technical Breakout Setups screen constantly searches the market for stocks combining high Technical Ratings with good setup patterns, giving traders a selected list of possible opportunities meeting these specific conditions.
Disclaimer: This analysis is based on technical indicators and historical price patterns and should not be considered investment advice. Technical analysis does not guarantee future performance and should be used as one component of a full investment strategy. Always conduct your own research, consider your risk tolerance, and consult with a financial advisor before making investment decisions. The breakout setup described represents a hypothetical trading scenario for educational purposes only.