
Our stock screening tool has pinpointed INTERNATIONAL SEAWAYS INC (NYSE:INSW) as an undervalued stock. NYSE:INSW maintains a solid financial footing. Furthermore, it remains attractively priced. Let's delve into the specifics below.
Understanding NYSE:INSW's Valuation
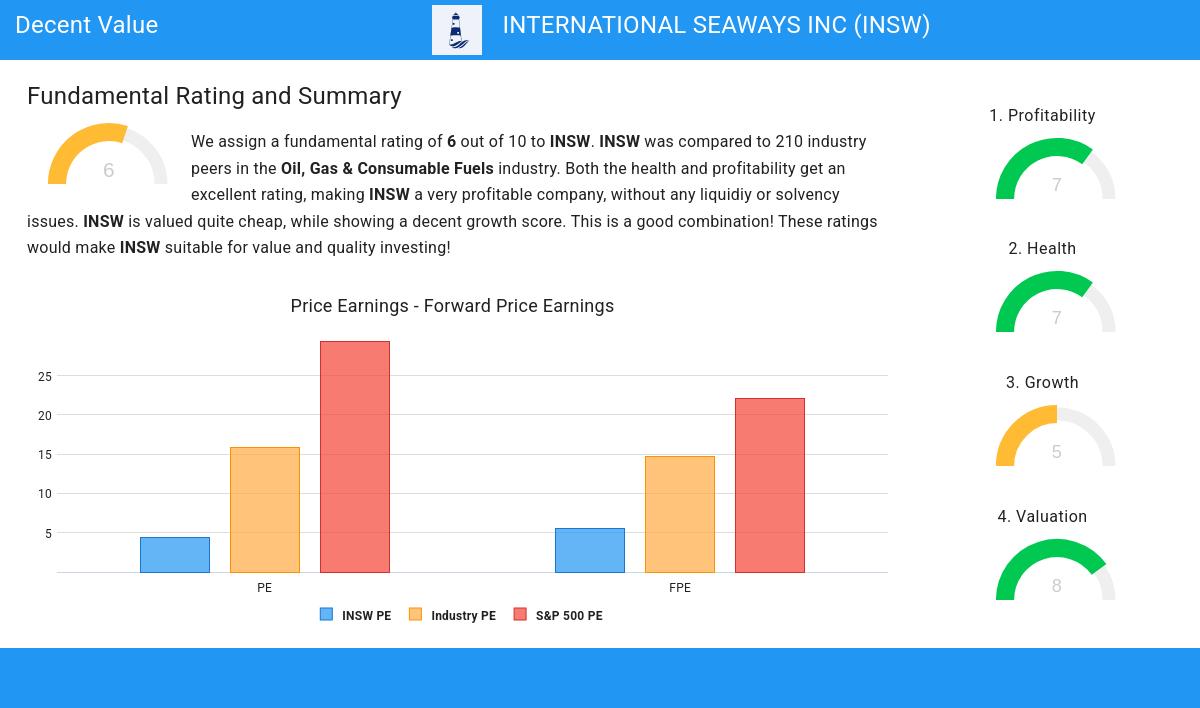
ChartMill assigns a Valuation Rating to every stock. This score ranges from 0 to 10 and evaluates the different valuation aspects and compares the price to earnings and cash flows, while taking into account profitability and growth. NYSE:INSW scores a 8 out of 10:
- Based on the Price/Earnings ratio of 4.43, the valuation of INSW can be described as very cheap.
- Based on the Price/Earnings ratio, INSW is valued cheaper than 89.16% of the companies in the same industry.
- INSW is valuated cheaply when we compare the Price/Earnings ratio to 29.41, which is the current average of the S&P500 Index.
- A Price/Forward Earnings ratio of 5.48 indicates a rather cheap valuation of INSW.
- Based on the Price/Forward Earnings ratio, INSW is valued cheaper than 86.21% of the companies in the same industry.
- The average S&P500 Price/Forward Earnings ratio is at 22.12. INSW is valued rather cheaply when compared to this.
- Based on the Enterprise Value to EBITDA ratio, INSW is valued a bit cheaper than 78.33% of the companies in the same industry.
- Based on the Price/Free Cash Flow ratio, INSW is valued cheaper than 82.27% of the companies in the same industry.
- The decent profitability rating of INSW may justify a higher PE ratio.
- A more expensive valuation may be justified as INSW's earnings are expected to grow with 17.27% in the coming years.
Profitability Analysis for NYSE:INSW
ChartMill employs its own Profitability Rating system for stock evaluation. This score, ranging from 0 to 10, is derived from an analysis of diverse profitability metrics and margins. In the case of NYSE:INSW, the assigned 7 is noteworthy for profitability:
- INSW's Return On Assets of 15.80% is amongst the best of the industry. INSW outperforms 88.67% of its industry peers.
- Looking at the Return On Equity, with a value of 22.44%, INSW belongs to the top of the industry, outperforming 80.30% of the companies in the same industry.
- INSW has a better Return On Invested Capital (13.33%) than 82.27% of its industry peers.
- INSW's Profit Margin of 43.77% is amongst the best of the industry. INSW outperforms 90.64% of its industry peers.
- The Operating Margin of INSW (44.42%) is better than 87.19% of its industry peers.
- In the last couple of years the Operating Margin of INSW has grown nicely.
- Looking at the Gross Margin, with a value of 67.23%, INSW is in the better half of the industry, outperforming 73.89% of the companies in the same industry.
- In the last couple of years the Gross Margin of INSW has grown nicely.
Looking at the Health
ChartMill employs a unique Health Rating system for all stocks. This rating, ranging from 0 to 10, is determined by analyzing various liquidity and solvency ratios. For NYSE:INSW, the assigned 7 for health provides valuable insights:
- INSW's Altman-Z score of 2.44 is fine compared to the rest of the industry. INSW outperforms 73.89% of its industry peers.
- INSW has a debt to FCF ratio of 2.58. This is a good value and a sign of high solvency as INSW would need 2.58 years to pay back of all of its debts.
- INSW's Debt to FCF ratio of 2.58 is fine compared to the rest of the industry. INSW outperforms 75.37% of its industry peers.
- A Debt/Equity ratio of 0.34 indicates that INSW is not too dependend on debt financing.
- INSW has a Current Ratio of 2.87. This indicates that INSW is financially healthy and has no problem in meeting its short term obligations.
- INSW has a Current ratio of 2.87. This is amongst the best in the industry. INSW outperforms 81.28% of its industry peers.
- A Quick Ratio of 2.86 indicates that INSW has no problem at all paying its short term obligations.
- The Quick ratio of INSW (2.86) is better than 83.25% of its industry peers.
A Closer Look at Growth for NYSE:INSW
To evaluate a stock's growth potential, ChartMill utilizes a Growth Rating on a scale of 0 to 10. This comprehensive assessment considers various growth aspects, including historical and estimated EPS and revenue growth. NYSE:INSW has achieved a 5 out of 10:
- The Earnings Per Share has been growing by 68.58% on average over the past years. This is a very strong growth
- Measured over the past years, INSW shows a very strong growth in Revenue. The Revenue has been growing by 21.05% on average per year.
- INSW is expected to show quite a strong growth in Earnings Per Share. In the coming years, the EPS will grow by 17.27% yearly.
Every day, new Decent Value stocks can be found on ChartMill in our Decent Value screener.
Our latest full fundamental report of INSW contains the most current fundamental analsysis.
Disclaimer
This is not investing advice! The article highlights some of the observations at the time of writing, but you should always make your own analysis and invest based on your own insights.