
In the field of growth investing, joining a strict technical system with attention to fundamental momentum can be an effective method for spotting possible leaders. One technique that shows this is the plan made known by trader Mark Minervini, which depends on his "Trend Template" to find stocks in clear, strong uptrends. This template works as a technical filter, making sure a candidate shows firm price movement, good moving average arrangements, and better relative performance before more study. The second important part requires judging the company's basic growth driver, searching for quickening earnings, solid sales growth, and gaining profitability, the signs of a genuine high-growth business. A stock that meets both the strict technical list and shows active fundamental momentum offers a strong argument for more review.
IDAHO STRATEGIC RESOURCES INC (NYSEARCA:IDR) has lately appeared on scans made to locate these double-checked chances. The company, a mineral explorer and developer centered on gold and silver properties in Idaho, seems to match the main ideas of this joined growth and momentum plan.
Reviewing the Technical Base: The Minervini Trend Template
The Minervini Trend Template is made to sort for stocks showing clear institutional backing and continued upward momentum. It is a detailed list where each condition works to affirm the stock's force. A look at IDR's present technical position shows it fits these main measures:
- Price Above Important Moving Averages: The stock's present price trades well above its rising 50-day, 150-day, and 200-day simple moving averages (SMAs). This arrangement points to positive feeling across short, middle, and long-term periods.
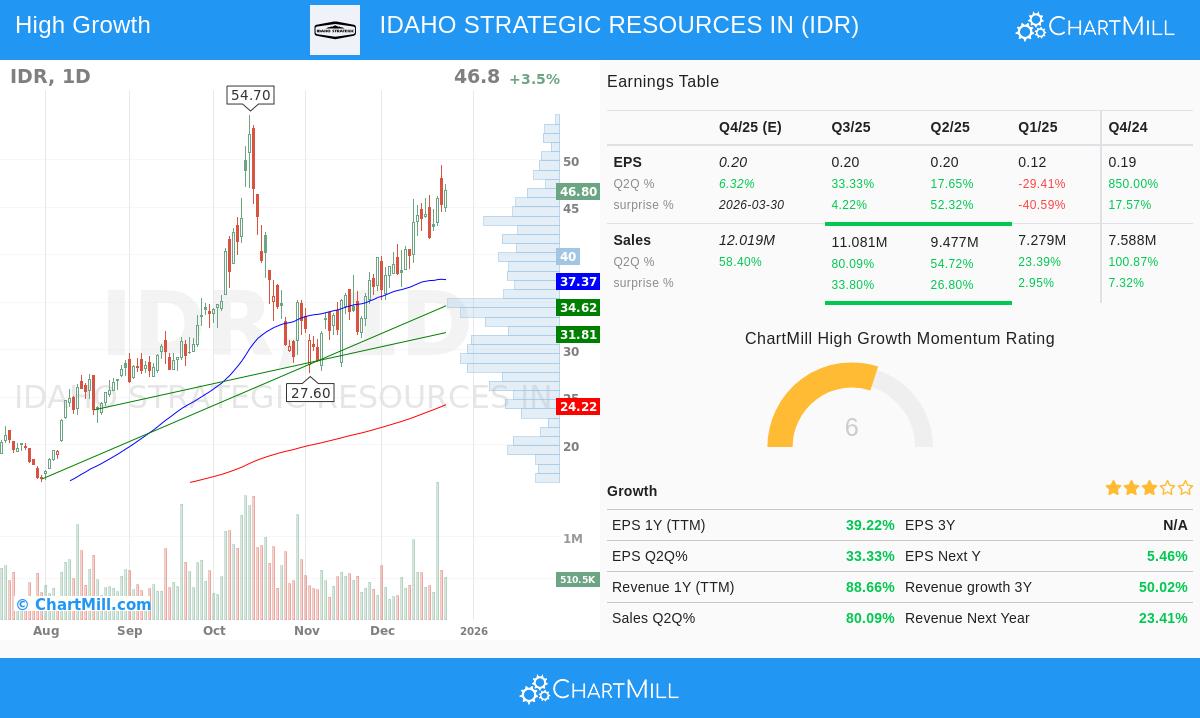
- Good Moving Average Arrangement: The 50-day SMA ($37.37) is placed above both the 150-day SMA ($27.36) and the 200-day SMA ($24.22), while the 150-day SMA also trades above the 200-day. This ordered positive arrangement is a standard mark of a firm Stage 2 rise.
- Nearness to Highs: IDR's present price is about 384% above its 52-week low and within 15% of its 52-week high of $54.70. Minervini's plan stresses concentrating on force, favoring stocks close to new highs instead of those staying near lows, as they frequently show the firmest momentum.
- Better Relative Performance: With a ChartMill Relative Strength (CRS) score of 99.13, IDR is doing better than almost every other stock in the market over the past year. High relative performance is a required part of the template, spotting market leaders that tend to lead rallies.
This combination of technical points indicates IDR is in a verified, strong uptrend, passing the first technical scan that aims to skip unstable or feeble price patterns.
Judging the Growth Driver: Fundamental Momentum
While a firm chart is necessary, the Minervini view stresses that the largest winners are nearly always backed by outstanding fundamental results. This is where the "High Growth Momentum" part of the scan becomes important, searching for proof of quickening business growth. IDR's recent financial numbers show several good signs:
- Rapid Earnings Growth: The company's trailing twelve-month (TTM) EPS has increased by over 39% year-over-year. More notably, its last reported full-year EPS jumped by 655%. This type of sharp earnings growth is a main force that draws institutional investment.
- Solid Revenue Growth: Top-line growth is equally active, with TTM revenue up about 89% and the last full-year revenue increasing by nearly 89%. Sales growth supplies the base for lasting earnings gains.
- Firm and Gaining Profitability: IDR has shown a capacity to turn revenue into profits well. The profit margin in the last reported quarter was a sound 29.2%, showing a large gain from the 22.1% margin in the earlier quarter. Rising margins show operational effectiveness and pricing ability.
- Positive Earnings Surprises: The company has topped analyst EPS guesses in two of the last four quarters, a signal that it is surpassing market hopes, a usual feature in new growth accounts.
These fundamental points show the "reason" behind the stock's strong price trend. The joining of climbing revenue, fast-rising earnings, and solid performance creates the fundamental force that Minervini's plan aims to match with a technically sound setup.
Technical Condition Summary
A different review of IDR's separate technical condition through ChartMill's study gives the stock a high technical score of 9 out of 10. The report states both its short-term and long-term trends are positive, and it places in the top group for yearly results, doing better than 94% of its Metals & Mining industry equals. However, the study also notes that the stock's setup score is presently lower, mentioning recent price movement that may make spotting an exact, low-risk entry point difficult now. This points out a key rule of the plan: even with very good technicals and fundamentals, careful entry timing is vital. For a full account of support levels, trend study, and the complete technical report, you can examine it here.
Locating Like Chances
IDAHO STRATEGIC RESOURCES INC offers an example in a stock that matches a controlled growth and momentum system, meeting conditions for both trend force and fundamental quickening. For investors curious in scanning for other firms that fit this particular mix of Minervini's trend template and high-growth momentum conditions, you can inspect the preset screen here.
Disclaimer: This article is for informational and educational purposes only. It is not a recommendation to buy or sell any security. The analysis is based on data provided and certain screening methodologies. All investing involves risk, including the potential loss of principal. You should conduct your own research and consider consulting with a qualified financial advisor before making any investment decisions.