
For investors who use charts and price action to make decisions, finding stocks that are both technically sound and ready for a move can be an effective strategy. One methodical approach involves looking for securities that show a solid existing trend while also forming a narrow trading range, a pattern that frequently comes before a breakout. This method uses two proprietary scores from ChartMill: the Technical Rating, which measures the general condition and trend of a stock, and the Setup Quality Rating, which judges the condition of its present consolidation pattern. A stock with high marks on both measures makes a strong case for technical investors, as it joins momentum with a possible low-risk entry point.
A recent scan using this method has identified INTERACTIVE BROKERS GRO-CL A (NASDAQ:IBKR) as a candidate showing these traits. The company, a global electronic broker offering trading and custody services for a wide variety of asset classes, is now displaying a noticeable technical formation that deserves attention.
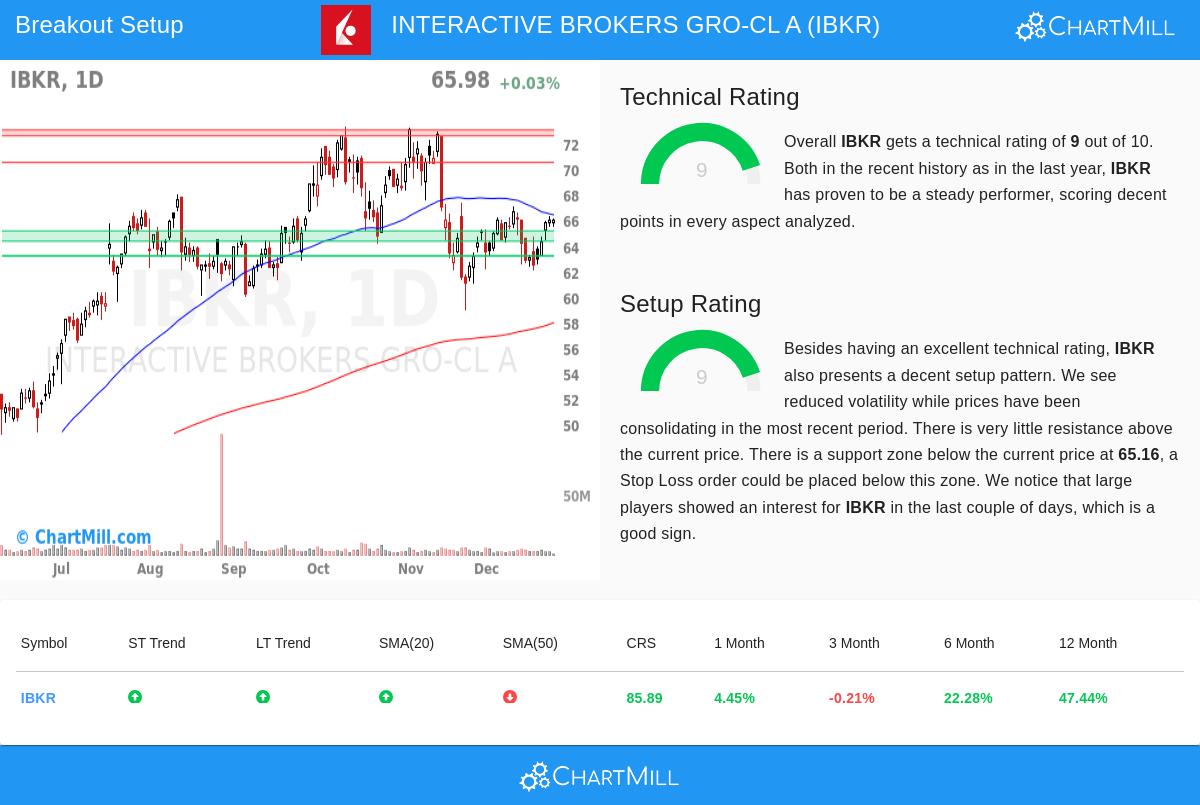
Technical Strength: A Base of Momentum
The foundation of this breakout strategy is first finding a stock with demonstrated strength, which is measured by ChartMill’s Technical Rating. A high rating indicates that a stock is in a confirmed uptrend, performing better than similar stocks, and showing positive momentum across different time periods. This is important because it raises the chance that any breakout from consolidation will follow the direction of the main trend.
Interactive Brokers receives a near-maximum Technical Rating of 9, putting it with the market's top performers from a technical view. The detailed technical report notes several bases of this strength:
- Positive Trend Alignment: Both the long-term and short-term trends for IBKR are rated as positive. This agreement points to continued buying pressure without major intermediate-term decline.
- Strong Relative Performance: The stock has performed better than 85% of all other stocks over the last year and is in the top 11% of its Capital Markets industry group. This shows sector strength.
- Supportive Moving Averages: The stock price is trading above important rising moving averages, including the 20-day, 100-day, and 200-day Simple Moving Averages (SMAs), which now serve as dynamic support levels.
This group of factors shows a stock in a sound, maintained uptrend, the type of base technical investors look for before thinking about an entry.
Setup Quality: The Consolidation Before the Move
While a solid trend is needed, it is not enough for a best entry. Buying a stock that has just completed a large, extended move brings the danger of an immediate decline. This is where the Setup Quality Rating becomes key. It finds times when a stock’s price action is becoming tighter, volatility is falling, and it is forming a base or consolidation area. A high setup score implies the stock is "coiling," possibly getting ready for its next directional move and offering a more defined area for setting protective stop-loss orders.
IBKR also gets a 9 on the Setup Quality Rating, signaling a very good consolidation pattern. The analysis highlights specific conditions that form this high-condition setup:
- Lower Volatility & Narrow Range: The stock has been trading in a set range over the recent period, letting moving averages move closer and reducing price volatility. This forms a clearer support level.
- Nearness to Support: A clear support zone exists between $64.35 and $65.16, made by a combination of trendlines and moving averages. This gives a logical and close level for risk management.
- Institutional Interest: The report states that large traders have shown interest in IBKR in recent days, as measured by the Effective Volume indicator, which can be a sign before notable price movement.
The existence of a narrow consolidation close to the highs of its recent range, together with solid existing technicals, places IBKR as a stock that could be close to trying a breakout to new highs.
Trade Considerations and Market Context
The automated analysis based on these ratings proposes a possible trading setup with an entry just above the recent range and a stop-loss order set below the identified support zone. It is essential for investors to perform their own analysis, thinking about factors like general market direction, currently, the S&P 500 shows positive long and short-term trends, and personal risk tolerance. The proposed stop distance is fairly close compared to the stock’s Average True Range, meaning traders should decide if a wider stop is better for their plan.
This example of Interactive Brokers shows the practical use of joining trend and setup analysis. For investors wanting to find similar chances, new possible breakout setups are found each day.
You can find more results from this Technical Breakout screen and run your own scans here: Technical Breakout Setups Screen.
,
Disclaimer: This article is for informational purposes only and does not constitute investment advice, a recommendation, or an offer or solicitation to buy or sell any securities. The analysis presented is based on technical indicators and automated scoring systems, which are not guarantees of future performance. All investing involves risk, including the possible loss of principal. Always conduct your own due diligence and consider consulting with a qualified financial advisor before making any investment decisions.