
For investors using a technical breakout strategy, the goal is to find stocks that are in a solid, confirmed uptrend and are also taking a break to move sideways. This break, or setup, forms a possible entry point with a clear risk level, as the stock gets ready for its next upward move. The method relies on two specific scores from ChartMill: the Technical Rating, which measures the general condition and trend force of a stock, and the Setup Quality Rating, which judges the condition of its present sideways pattern. A strong score in both areas indicates a stock is a leading choice for a technical breakout setup.
H World Group Ltd-ADR (NASDAQ:HTHT) appears from such a scan, presenting an interesting profile for technical investors. The company, a large operator of hotels across different brands and segments in China and other countries, is displaying a strong mix of trend force and a favorable price formation.
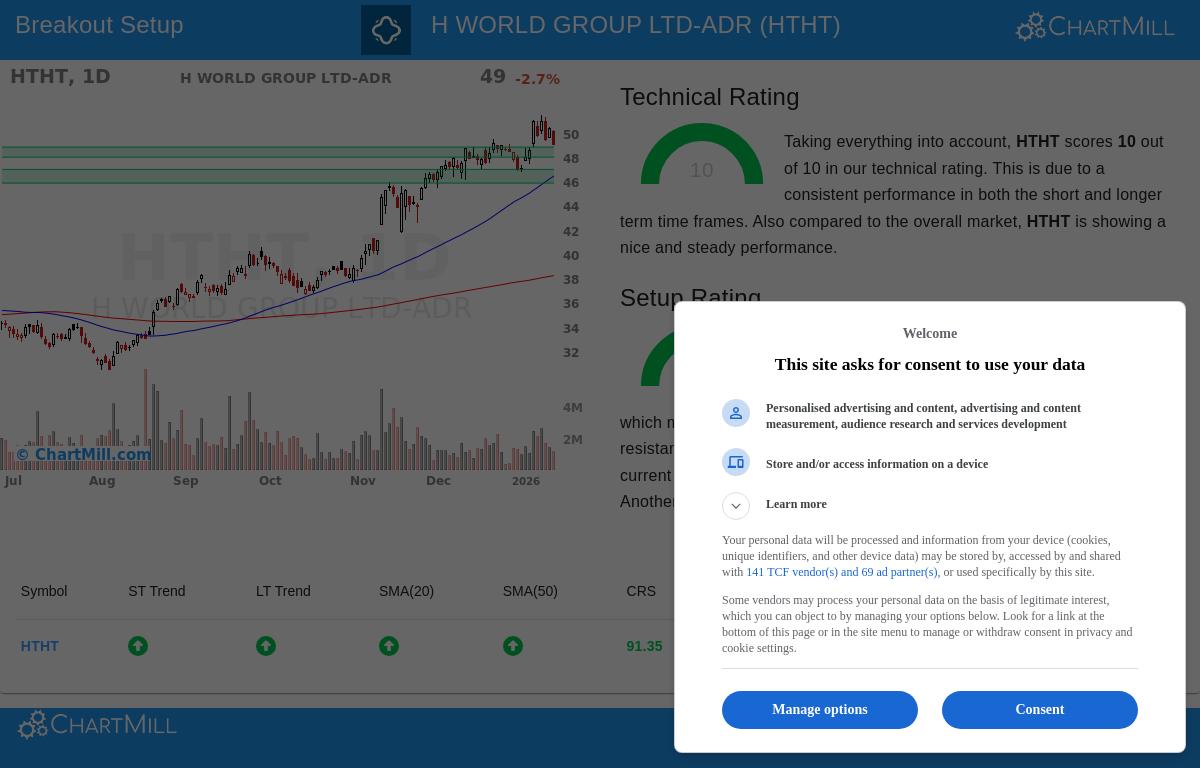
Technical Force: A High-Level Performer
The base of any breakout trade is a stock with clear upward momentum, and HTHT earns a perfect 10 on the ChartMill Technical Rating. This high score points to very good technical condition across several time periods. A look into the full technical report shows the reasons for this top score:
- Trend Agreement: Both the near-term and longer-term trends for HTHT are marked as positive, a strong sign that momentum is agreed upon across different investor holding periods.
- Market and Group Performance: The stock's results place it in the leading group of the market, doing better than 91% of all stocks over the last year. Inside its Hotels, Restaurants & Leisure field, it outperforms 97% of its 133 competitors.
- Price Level and Moving Averages: HTHT is trading close to its 52-week high, a typical trait of a leading stock. Also, its price is positioned above all main moving averages (20, 50, 100, and 200-day), and each of these averages is itself in a rising pattern, forming a layered support base below the price.
This solid technical background is important for the breakout strategy because it raises the chance that any upward move from a sideways period will continue, instead of being a failed signal in a weak or unstable trend.
Setup Condition: A Tight Formation
While a forceful trend is needed, it is not enough for a good entry. Buying a stock that has just completed a big, stretched move often results in buying at a high point. This is where the Setup Quality Rating of 9 becomes key. It shows HTHT is in a favorable sideways period, becoming more compact before a possible new rise.
Main parts of this setup consist of:
- Recent Price Range: Over the last month, HTHT has traded between $46.77 and $51.46. The stock is currently moving sideways in the middle of this range, which can provide a good balance of risk and reward for entry as it gathers force for a possible move to the top of the range.
- Clear Support Area: The analysis notes a major support area between $47.98 and $48.81, made by a combination of trendlines and moving averages. For a trader, this gives a reasonable and specific place to set a protective stop-loss order, a key part of managing risk.
- Favorable Volume Behavior: A recent "Pocket Pivot" signal—a price rise on volume higher than normal—hints at buying by larger participants during this sideways phase, adding another point of confirmation to the setup.
The high Setup Rating speaks directly to the "when" of the strategy. It shows the stock is not stretched too far but is instead forming a base, giving a planned entry point with a close support level to control possible loss.
A Possible Trade Plan
From this analysis, ChartMill's system proposes a specific trade plan, showing how a technical investor might look at HTHT. The idea involves an entry just above the present level at $49.11, with a stop-loss set below the noted support area at $47.97. This plan would cap the theoretical loss on the trade to about 2.3%. It is important to state that this is an automated example; investors should always do their own study to decide entry, exit, and trade size that fit their personal risk level.
Finding Other Ideas
H World Group Ltd shows the kind of idea the Technical Breakout screen is made to find: a market leader pausing inside a forceful uptrend. For investors looking for similar setups, new choices are found each day. You can see the present list of technical breakout setups by going to the Technical Breakout Setups screen.
Disclaimer: This article is for information only and is not investment advice, a suggestion, or an offer to buy or sell any security. The analysis uses technical measures and past data, which are not promises of future results. Investing has risk, including the possible loss of the amount invested. Always do your own research and think about talking with a qualified financial advisor before making any investment choices.