
Technical analysis often relies on identifying stocks with strong underlying momentum and favorable entry points, a strategy that combines trend strength with consolidation patterns to pinpoint potential breakouts. This approach evaluates both the technical health of a stock and the quality of its current setup, aiming to capture moves when a security transitions from a period of stability into a new uptrend. H World Group Ltd-Adr (NASDAQ:HTHT) emerges from a screen designed to filter for such characteristics, displaying notable technical ratings that suggest it may be well-positioned for momentum-focused investors.
Technical Strength and Trend Analysis
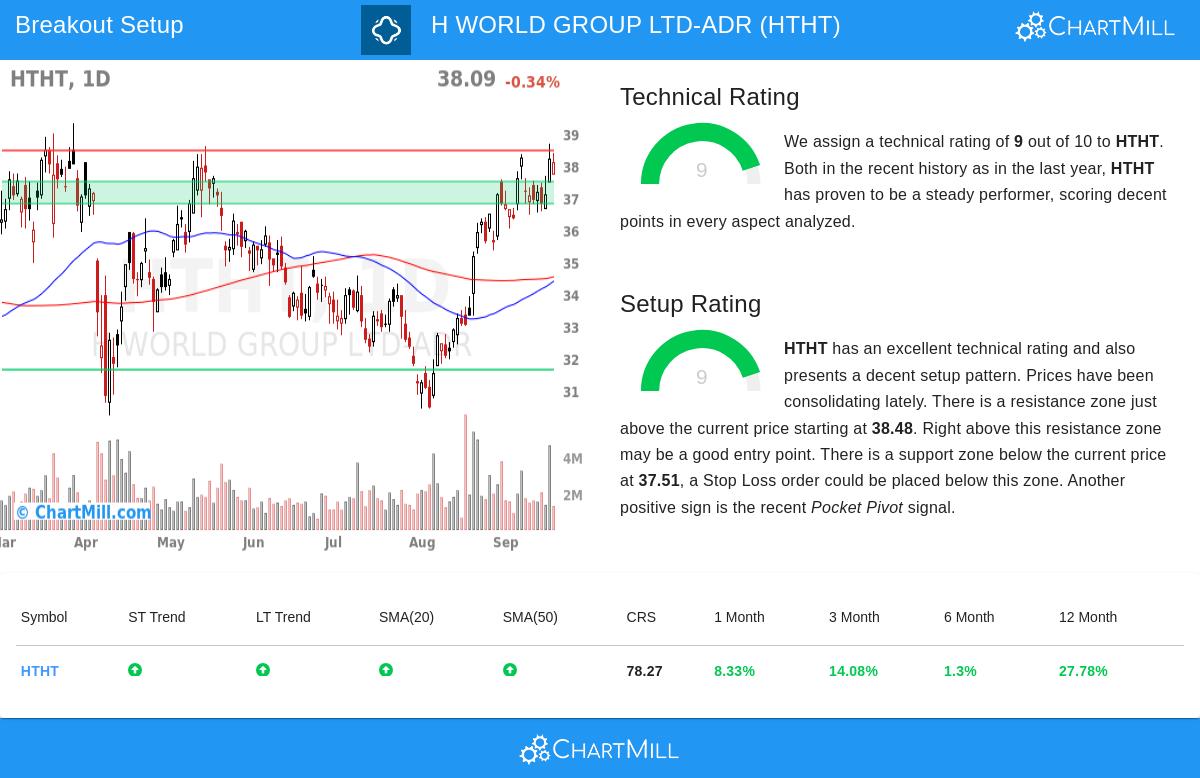
HTHT demonstrates solid technical health, as reflected in its ChartMill Technical Rating of 9 out of 10. This score incorporates multiple factors that signal sustained upward momentum and relative outperformance. Key elements contributing to this rating include:
- A positive long-term and short-term trend, indicating consistency across timeframes.
- Strong relative strength, with the stock outperforming 78% of all stocks over the past year and 76% of its peers in the Hotels, Restaurants & Leisure industry.
- Price action above key moving averages (20-day, 50-day, 100-day, and 200-day), all of which are rising, reinforcing the bullish structure.
These attributes are critical for the breakout strategy, as they help ensure the stock is in a confirmed uptrend and possesses the momentum needed to sustain a move higher after breaking out of consolidation.
Setup Quality and Consolidation Pattern
Equally important for breakout investors is the setup quality, which assesses whether a stock is consolidating in a way that provides a clear, low-risk entry point. HTHT earns a Setup Rating of 9, indicating a high-quality consolidation pattern. The analysis highlights:
- A recent pocket pivot signal, suggesting accumulation and bullish volume characteristics.
- A well-defined support zone between $36.82 and $37.51, offering a logical area for stop-loss placement.
- Resistance near $38.48, which, if broken, could trigger a breakout and signal the next leg up.
This combination of tight consolidation, clear support, and nearby resistance aligns with the strategy’s goal of entering on strength after a period of stability, thereby reducing entry risk and improving potential reward-to-risk ratios.
Trade Structure and Market Context
The proposed breakout setup suggests an entry above $38.49, just past resistance, with a stop-loss below $36.81. This results in a risk of approximately 4.36% on the trade, which, when sized appropriately, could allow for controlled position management. It is worth noting that while HTHT shows strong technicals, it currently trades in the middle of its 52-week range, lagging the broader S&P 500, which is near highs. This may present a catch-up opportunity if the breakout occurs.
For a detailed look at the technical indicators and chart patterns, readers can review the full technical report for HTHT.
Exploring Additional Breakout Opportunities
Investors interested in reviewing other stocks that exhibit similar technical strength and setup quality can explore the Technical Breakout Setups screen for daily updated results. This tool systematically identifies securities that meet the dual criteria of high technical and setup ratings, serving as a starting point for further analysis.
,
Disclaimer: This article is for informational purposes only and does not constitute investment advice or a recommendation to buy, sell, or hold any security. Investing involves risks, including the potential loss of principal. Always conduct your own research and consider your financial situation and risk tolerance before making investment decisions.