
For investors focused on chart patterns and momentum, a methodical process for spotting possible trades can be very useful. One process uses filters to find stocks that are both technically sound and building a constructive price pattern, frequently before a possible breakout. This tactic usually searches for two main proprietary scores: a high Technical Rating, which verifies the stock is in a sound uptrend, and a high Setup Quality Rating, which shows the stock is consolidating in a tight range, providing a clear and lower-risk entry point. The aim is to find leading stocks that are resting before their next move up.
HENRY SCHEIN INC (NASDAQ:HSIC) recently appeared from such a filter, showing a profile that deserves more examination from a technical viewpoint. As a major distributor of healthcare products and services to dental, medical, and veterinary practitioners, the company's stock is now displaying traits that match this breakout method.
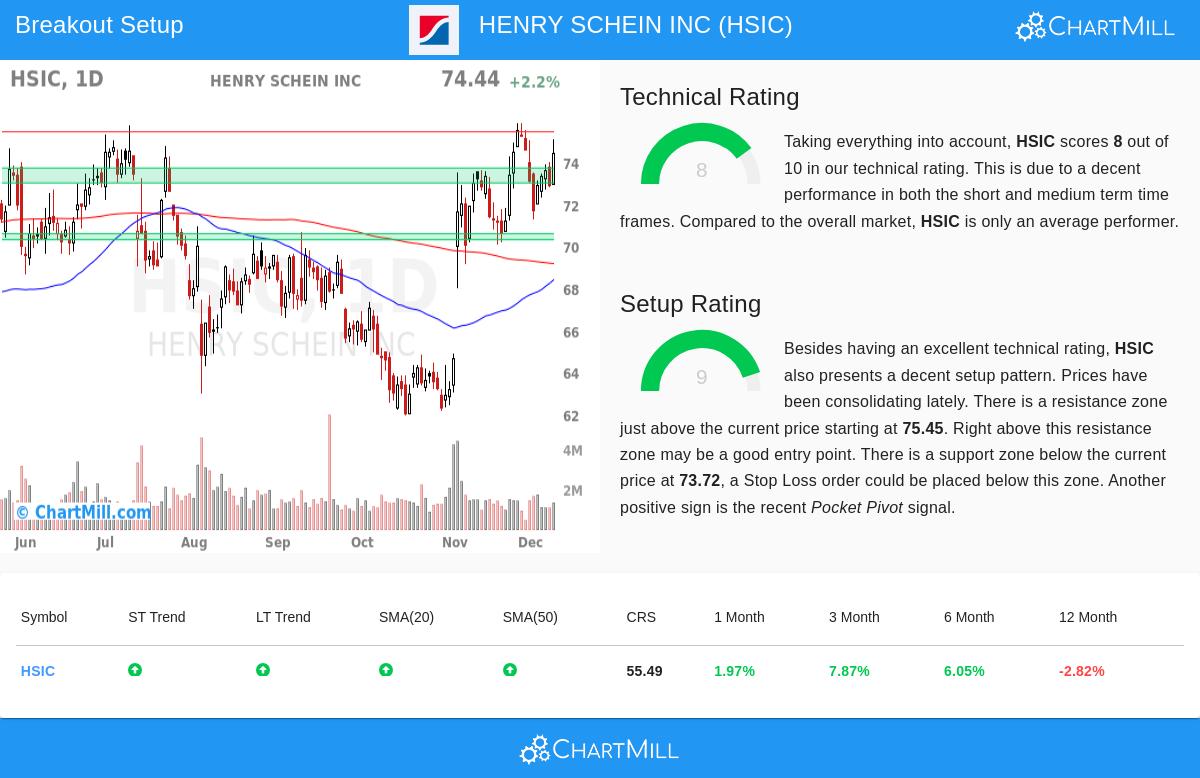
Technical Strength: A Sound Base
The first part of this tactic is confirming the stock's basic trend is positive. A high Technical Rating is important because it selects for stocks already in clear uptrends, raising the chance that a breakout will persist in the current direction. Henry Schein receives a solid Technical Rating of 8 out of 10, indicating sound technical condition.
The detailed technical report notes several supporting factors:
- Trend Alignment: Both the long-term and short-term trends for HSIC are rated as positive. This agreement across timeframes is a standard sign of a sound trend, lessening the noise and mixed signals that can happen when trends are not aligned.
- Moving Average Support: The stock is trading above important short- and medium-term moving averages, including the 20-day, 50-day, and 100-day Simple Moving Averages (SMAs), all of which are increasing. This arrangement shows steady buying pressure and builds a series of possible support levels below the current price.
- Steady Performance: The stock has shown sound momentum over recent months, with positive returns over the past one, three, and six-month periods. This performance, happening alongside a positive broader market, indicates the trend has strength.
This technical foundation is necessary for the tactic, as it makes sure an investor is aiming to trade in the direction of the current momentum, not opposite to it.
Setup Quality: The Pattern for a Possible Breakout
A sound trend by itself is not a signal to buy; entering at a high price can lead to quick pullbacks. This is where the Setup Quality Rating becomes key. It finds periods of consolidation or "tight" trading, which frequently come before the next price move. Henry Schein has an outstanding Setup Rating of 9, showing a high-grade pattern is present.
The examination highlights specific traits that describe this positive setup:
- Bull Flag Formation: The report states HSIC is currently displaying a bull flag pattern. This is a continuation pattern where prices decline slightly in a narrow range after a strong rise, looking like a flag on a pole. It shows a pause in the trend and can be a sign of another move up.
- Clear Support and Resistance: The setup is bounded by definite technical levels.
- Immediate Resistance: A horizontal line is at $75.45. A clear move above this level could show the consolidation is finishing and the breakout is starting.
- Nearby Support: A sound support zone is found between $73.01 and $73.72, made by a combination of trendlines and moving averages. This gives a reasonable area to set a protective stop-loss order, clearly stating the risk of the trade if the breakout does not succeed.
- Supportive Volume Activity: A recent "Pocket Pivot" signal was seen, which is a volume-based indicator showing accumulation (price increasing on higher volume than recent down days). This suggests institutional buying interest may be happening within the consolidation, adding believability to the setup.
A Stated Trading Plan
From this technical and setup examination, a possible trade plan appears. The reasoning follows the breakout tactic: enter on a confirmed move above resistance, with a stop-loss set below nearby support to control risk.
- Suggested Entry: A buy stop order could be set at $75.46, just above the $75.45 resistance level. This order would only be activated if the stock breaks out, confirming buyer commitment.
- Suggested Exit (Stop-Loss): A stop-loss order could be placed at $73.00, set below the identified support zone. This caps the possible loss on the trade to about 3.26% from the entry point.
- Risk Control: For a portfolio with a total risk tolerance of 0.82% on this idea, the position size could be adjusted to about 25% of capital.
It is very important to state that this is an example created from the technical parameters, not a suggestion. Investors must think about their own risk tolerance, perform their own examination, and know about company-specific news or coming events like earnings reports that could affect the price regardless of the technical pattern.
Finding Other Chances
Henry Schein shows how mixing trend strength with a high-grade consolidation pattern can spotlight possible breakout candidates. For investors wanting to use this methodical process, new setups are found each day. You can search for other chances using the Technical Breakout Setups screen.
Disclaimer: This article is for information only and does not form investment advice, a suggestion, or an offer or solicitation to buy or sell any securities. The examination is based on technical indicators and past data, which are not assurances of future results. Investing includes risk, including the possible loss of principal. Always do your own research and think about talking with a qualified financial advisor before making any investment choices.