
Investors looking to find companies with the possibility for major capital appreciation frequently use a two-part method, joining strict fundamental study with technical market timing. One such tactic involves filtering for powerful growth stocks that are also showing promising technical breakout formations. The idea is simple: find firms with solid and speeding business fundamentals, such as earnings growth, profitability, and financial condition, and then search for a good technical entry point where the stock price might be ready to increase. This technique tries to combine the long-term potential of a growing business with the nearer-term momentum that can be identified through chart study. A recent filter using this tactic has pointed to HEALTHEQUITY INC (NASDAQ:HQY) as a candidate deserving of further review.
A Solid Fundamental Base
At its heart, a growth stock must show a capacity to grow its business at a rate faster than normal. Based on the fundamental analysis report for HealthEquity, the company receives a good total rating of 6 out of 10, with especially high ratings in Growth (7), Profitability (7), and Health (7). This group of three creates a persuasive base for a growth investment argument.
- Notable Growth Path: HealthEquity displays strong momentum in its main financial figures. Over the last year, Earnings Per Share (EPS) increased by a notable 22.15%, while Revenue rose by 12.20%. More significantly, this is not a single occurrence; the company has shown a steady multi-year growth pattern, with average yearly EPS growth of 12.72% and Revenue growth of 17.66%. Analysts predict this positive pattern will persist, estimating average yearly EPS growth of 19.06% in the next few years.
- High Profitability and Margins: Growth is most useful when it is profitable. HealthEquity performs well here, having industry-leading margins. Its Profit Margin of 14.86% and Operating Margin of 23.20% are better than 99% and 97% of similar companies in the Health Care Providers & Services industry, in that order. This shows the company can effectively turn revenue into earnings, a vital trait for lasting growth.
- Solid Financial Condition: A sturdy balance sheet gives the stability required to endure economic shifts and fund future growth. HealthEquity’s financial health rating is a main positive, backed by very good liquidity measures. Its Current Ratio and Quick Ratio of 4.13 are with the highest in its industry, indicating sufficient ability to meet near-term debts. While the company has some debt, its Debt-to-Equity ratio of 0.46 is acceptable and more favorable than many rivals.
These fundamental traits match well with the qualitative standards for finding growth stocks, like working in a big target market (healthcare savings and spending) and showing the capacity to keep a competitive edge through high profitability.
Valuation and Technical Position
While fundamentals explain the company's engine, valuation and technicals help evaluate the price of the ticket. HealthEquity’s Valuation rating is a neutral 4, implying the market has accounted for much of its quality. With a P/E ratio near 25.5, it trades similarly to the wider S&P 500 but at a lower price than its industry peers, which average a P/E of 38. This comparative value, joined with its high growth rate, leads to a fair PEG ratio, suggesting the stock may not be expensive considering its growth outlook.
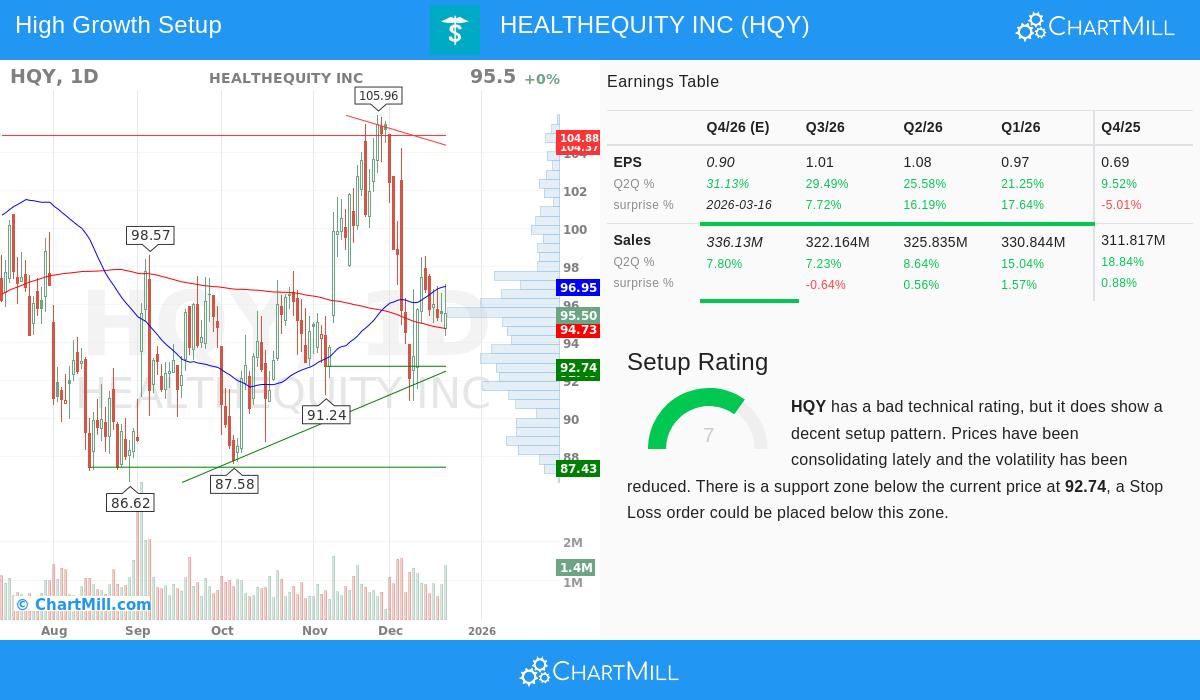
The technical view, as explained in the technical analysis report, is where the "setup" part of the tactic becomes relevant. Even with a moderate total technical rating of 2, the report notes a hopeful Setup Rating of 7. This means that while the stock's recent price movement has been neutral to poor in the short term, it is now settling in a manner that might come before a new move.
- The stock is trading in the middle of its 52-week range, having lately moved down from highs near $106.
- This settling has happened with lower volatility, narrowing the trading range.
- A clear support area has been formed between about $92.50 and $92.75, created by the meeting of several trendlines. This gives a specific technical level where buyer activity could strengthen.
- The nearby resistance area is between $96.50 and $98.25, which also matches with important moving averages. A continued move above this zone might indicate a return of the longer-term upward trend.
This technical arrangement is exactly what the filtering method looks for: a fundamentally solid company whose stock is pausing after a previous rise, possibly giving a measured entry point close to support before its next increase.
Summary
HealthEquity offers a situation that matches the "strong growth with a technical setup" tactic. The company’s fundamental picture is noted by speeding earnings, better profitability, and a very strong balance sheet, signs of a lasting growth business. Technically, the stock is absorbing its advances and nearing a clear zone of support. For investors using this joined study method, HQY stands as a candidate where good business results might be close to being shown in its share price again.
This study of HealthEquity came from a specific investment filter. You can review more stocks that now match this "Strong Growth Stocks with good Technical Setup Ratings" standard by seeing the complete filter results here.
Disclaimer: This article is for informational and educational reasons only and does not form a suggestion to buy, sell, or hold any security. The study is based on data and reports given by other parties. Investing in stocks includes risk, including the possible loss of principal. You should do your own research and talk with a qualified financial advisor before making any investment choices.