
For investors who use charts and price action to guide their choices, the search for promising opportunities often involves finding stocks that are both technically sound and ready for a move. One methodical way to do this is using a Technical Breakout screen, which looks for stocks showing two main traits: a high Technical Rating, pointing to a sound and healthy uptrend, and a high Setup Quality Rating, indicating a time of consolidation that might come before a new rise. This approach tries to join the momentum of a leading stock with the tactical benefit of a clear entry point, with the goal of taking part in the next possible breakout.
A recent scan using this method has pointed out Helmerich & Payne (NYSE:HP) as a candidate deserving closer study from a technical viewpoint. The oil and gas drilling contractor’s stock seems to be forming a pattern that often draws trend-following investors.
Looking at the Technical Base
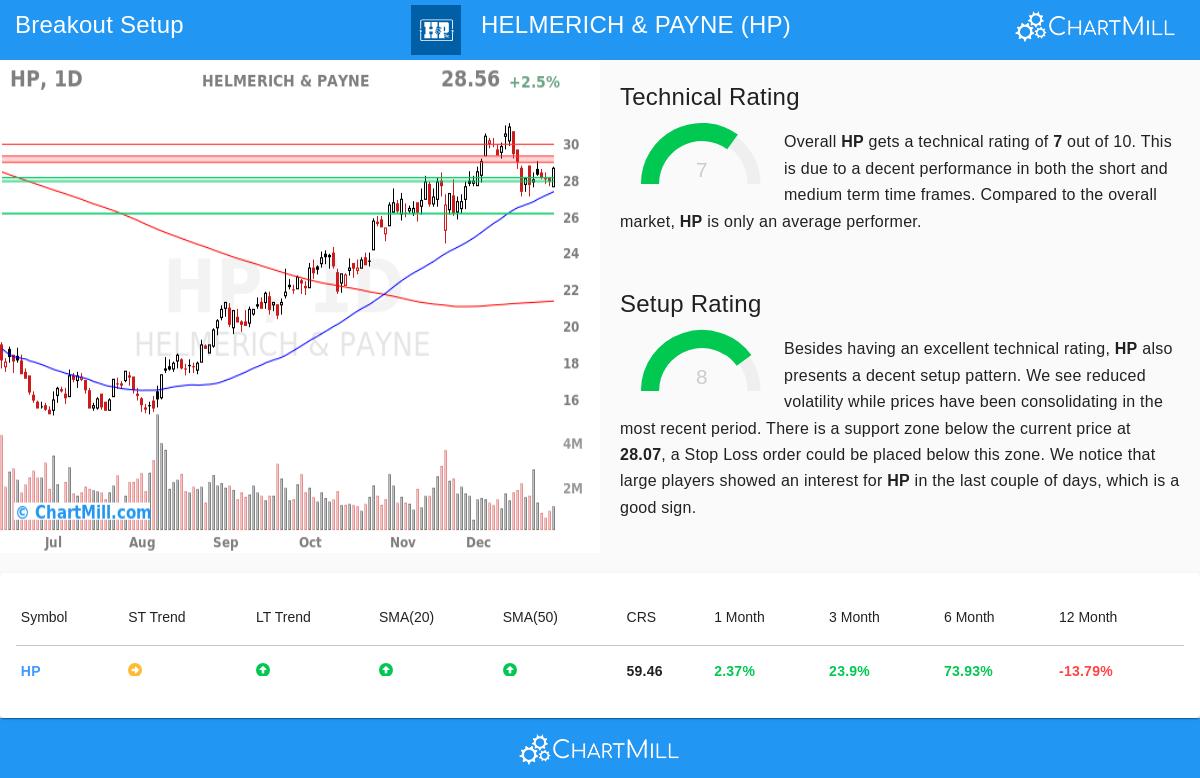
The heart of any breakout plan starts with the main trend; there is little reason to buy a consolidation if the wider direction is lower. Helmerich & Payne’s ChartMill Technical Rating of 7 out of 10 points to a firm technical base. This number brings together several factors across different time periods to measure the stock’s condition.
- Trend Position: The long-term trend is seen as positive, which is an important background for any bullish setup. The short-term trend is now neutral, showing a pause or consolidation inside that larger uptrend.
- Moving Average Backing: The stock is trading above its important rising moving averages (20, 50, 100, and 200-day SMAs), a typical sign of a sound uptrend. This position gives a series of possible support levels.
- Relative Performance: While not a market frontrunner, HP’s performance is adequate. It has done better than 59% of all stocks and 59% of its Energy Equipment & Services peers over the last year.
This technical rating of 7 meets the first important filter of the breakout screen, showing that HP is not in a downtrend but is placed within a good medium to long-term uptrend. A stock must first show this kind of condition to be thought of as a workable candidate for a continuation pattern.
Looking at the Setup Quality
A sound trend by itself is not a signal; buying after a sharp rise holds the chance of a quick drop. This is where the Setup Quality Rating becomes key. It finds times when a stock’s price action becomes tighter, hinting at a balance between buyers and sellers and often making a base for the next move. HP’s Setup Rating of 8 is especially sound and is the main reason it is on the watchlist.
The technical report explains the conditions making this positive setup:
- Consolidation Happening: The report states "reduced volatility while prices have been consolidating in the most recent period." This is the sign of a good setup, a pause that allows the stock to absorb earlier gains.
- Clear Support and Resistance: The study finds a defined support area between $27.85 and $28.07, made by a combination of trendlines and moving averages. On the other hand, nearby resistance is between $28.90 and $29.24. This makes a clear trading range.
- Institutional Activity: Another positive point is that large investors have shown activity in HP lately, as measured by the Effective Volume indicator. This can sometimes come before more continued buying.
The high setup score speaks directly to the "when" question for technical investors. It shows that HP is not stretched but is instead tightening inside a range, giving a sensible area for a stop-loss (below support) and a defined breakout level (above resistance) to mark a possible return to the uptrend.
Trade Plan and Important Levels
Based on this technical and setup study, a possible trading plan comes into view. The automated report proposes an entry point at $29.25, which would be activated if the stock moves above the noted resistance area. A stop-loss order at $27.84 would be set just below the main support area, capping the theoretical trade risk to about 4.8%.
It is important to see this as an example showing how to use the levels from the study, not as a specific suggestion. Traders might decide to change these levels based on their own risk comfort and time frame.
Finding Other Chances
The scan that found Helmerich & Payne is run each day, looking through the market for other stocks that show this mix of technical condition and a tightening setup. For investors wanting to see the current list of possible breakout candidates, the results can be found using the Technical Breakout Setups screen.
Disclaimer: This article is for information only and does not make up investment advice, a suggestion, or an offer to buy or sell any security. The study is based on technical data and automated reports. All investing and trading has risk, including the possible loss of principal. Investors should do their own research and think about their personal money situation before making any investment choice. Past results are not a guide to future results.