
Technical investors often seek stocks showing both solid basic momentum and good entry points, usually found through consolidation patterns that come before possible breakouts. This method uses two main measures: the Technical Rating, which judges the general condition and trend strength of a stock, and the Setup Quality Rating, which checks for a clear consolidation pattern giving defined support and resistance levels. Stocks with high scores on both measures are seen as leading choices for breakout strategies, as they represent technically good instruments set for possible upward moves.
HOLOGIC INC (NASDAQ:HOLX) now shows a strong profile for such strategies, with a Technical Rating of 8 and a Setup Rating of 9. These scores point to sound technical bases along with an appealing consolidation pattern, indicating the stock might be set for a notable move.
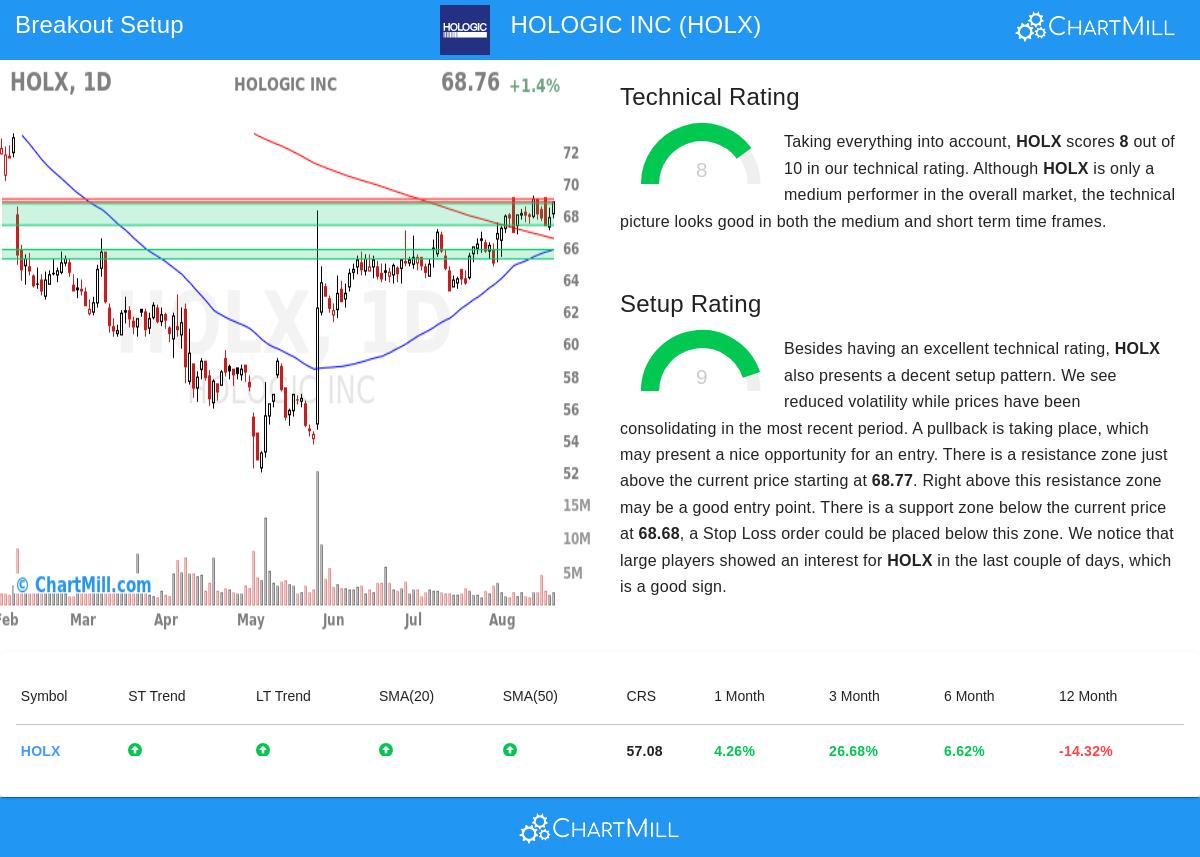
Technical Strength and Trend Analysis Hologic’s Technical Rating of 8 shows solid momentum across multiple timeframes. Both its short-term and long-term trends are positive, supporting the stock’s upward path. The price is trading above important moving averages, including the 20-day, 50-day, and 100-day SMAs, all of which are rising, a basic sign of continued bullish feeling. This technical condition is key for breakout strategies because it means the stock is already in a positive trend, raising the chance that a breakout will result in continued gains instead of a false signal.
Setup Quality and Consolidation Pattern With a Setup Rating of 9, Hologic is now showing a high-grade consolidation pattern. The stock has been trading in a fairly narrow range with lower volatility, forming what technical analysts often call a bull flag, a pause in the trend that usually comes before another move higher. This pattern is significant because it gives a clear level of support, in this case near $68.68, which acts as a sensible place for a stop-loss order, thus setting and controlling risk. Also, the resistance area just above the current price, starting at $68.77, gives a well-marked breakout level. A move above this resistance might signal the restart of the upward trend.
Risk and Opportunity Dynamics The suggested trade setup proposes an entry point at $68.99, just above the resistance area, with a stop-loss at $67.32. This controls the possible loss to about 2.42% of the trade value, an acceptable risk for most technical traders. Furthermore, the existence of several support areas below the current price adds a degree of safety, as these levels might help soften any downward movement. It is also important to note that large players have shown interest in HOLX lately, often a good sign of institutional accumulation.
For investors wanting to look into similar technical breakout chances, other choices can be examined using the Technical Breakout Setups screen. This tool methodically finds stocks with high Technical and Setup Ratings, making the process of finding possible breakout plays simpler.
Disclaimer: This analysis is for informational purposes only and does not constitute investment advice. Investors should conduct their own research and consider their risk tolerance before making any trading decisions.