
For investors using chart patterns and momentum, a systematic method can help find stocks ready for their next rise. One such process looks for stocks that are both technically sound and forming a constructive consolidation pattern. This plan uses two specific metrics: the ChartMill Technical Rating, which reviews the general condition and trend of a stock, and the ChartMill Setup Quality Rating, which judges the state of its present price formation. The aim is to locate market leaders that are resting after an advance, presenting a possible entry point before a breakout. A recent scan using this process has identified Harmony Gold Mng-Spon ADR (NYSE:HMY) as a candidate showing these traits.
Technical Strength: A Top-Tier Rating
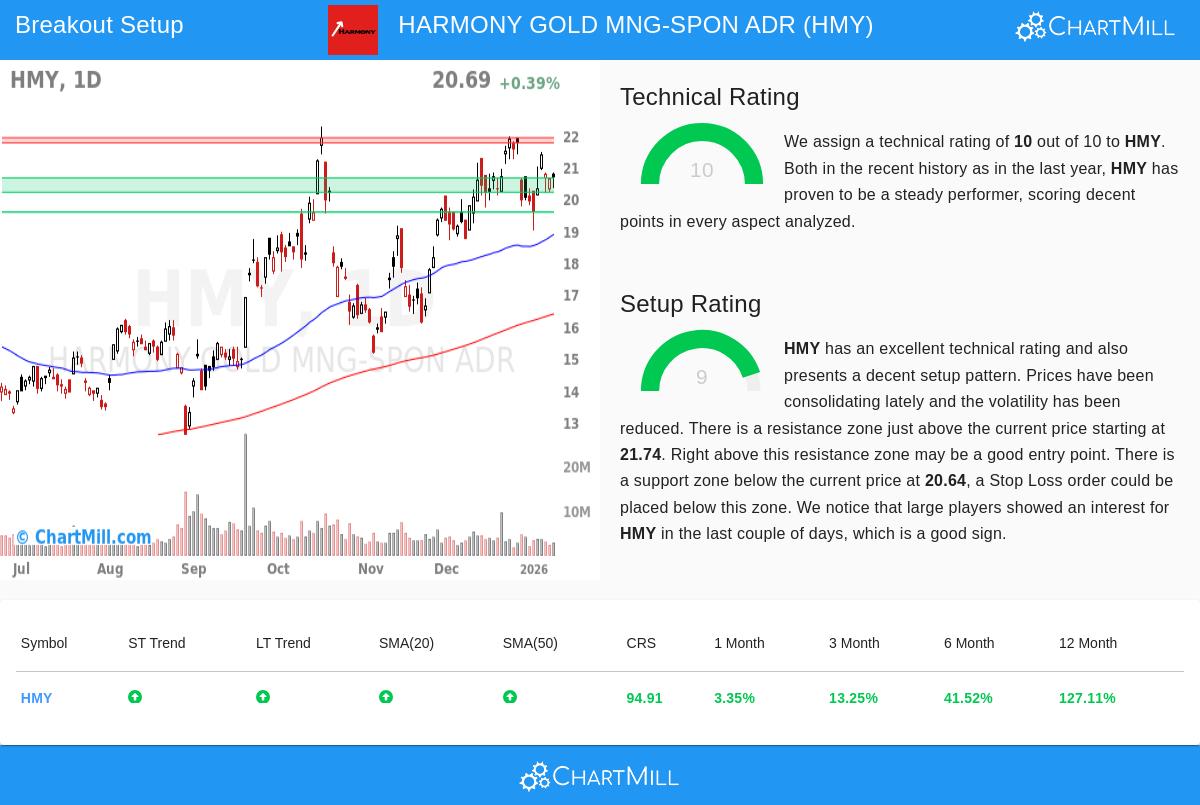
The base of this plan is a stock's fundamental technical condition, as a solid trend supplies the momentum required for a good breakout. Harmony Gold receives a complete ChartMill Technical Rating of 10 out of 10, putting it in the market's best from a trend viewpoint. An examination of the full technical report shows the supports of this soundness.
- Trend Alignment: Both the short-term and long-term trends for HMY are labeled positive. This agreement across time periods is a strong signal, showing sustained buying pressure and a small chance of the main uptrend ending suddenly.
- Dominant Relative Strength: When measured against the wider group of stocks, HMY's performance is notable. It is doing better than 94% of all stocks over the last year, a clear mark of institutional preference and leadership.
- Moving Average Support: The stock's price is trading above all its main simple moving averages (20, 50, 100, and 200-day), and each of these averages is itself in a rising pattern. This layered, positive alignment works as a set of dynamic support levels.
This sound technical background is important for the plan because it selects for stocks already in a confirmed uptrend. Trading breakouts in these stocks has a greater chance of success than trying to find a low in a falling issue.
Setup Quality: A Coiled Spring
While technical soundness finds the which, the setup quality speaks to the when. A high score here implies the stock is consolidating gains in a steady way, storing energy for its next rise. Harmony Gold gets a 9 out of 10 on the Setup Quality Rating, showing a high-grade pattern.
- Consolidation Within a Range: Over the last month, HMY has been trading between $19.00 and $21.96. The present price near $20.69 sits in the middle of this range, showing a time of lower volatility and price compression. This tightening action often comes before a clear move.
- Clear Support and Resistance: The review finds a definite support area between $20.19 and $20.64, made by a meeting of trendlines and moving averages. On the other side, a main resistance area sits between $21.74 and $21.90. These clear levels give logical points for placing stop-loss and breakout entry orders.
- Institutional Interest: The report states that large players have shown interest in HMY in recent days, as seen by volume review. This can be a confirming sign that informed money is positioning itself during the consolidation.
This high-grade setup is the central piece of the plan. It lets an investor set a low-risk entry point (just above resistance) with a closely managed stop-loss (just below support), making a good risk/reward situation. The consolidation supplies the "coil" that, when released, can lead to a fast price move.
A Potential Trading Scenario
Based on the meeting of technical soundness and setup quality, the review proposes a specific breakout scenario. A move above the resistance area, specifically a break above $21.91, could be used as a trigger to enter the trade. To control risk, a stop-loss order could be placed below the support area at $20.18. This plan would limit the possible loss on the trade to about 7.9% of the entry price, a set and acceptable risk for many technical traders.
Finding More Opportunities
The mix of a complete Technical Rating and a near-complete Setup Rating makes Harmony Gold a clear example of the type of opportunity this scanning method is made to find. For investors wanting to see the present list of stocks meeting these strict conditions, the Technical Breakout Setups scan is updated daily and can be found here.
Disclaimer: This article is for information only and does not form investment advice, a suggestion, or an offer or request to buy or sell any securities. The trading scenario described is an automatic, theoretical example based on technical indicators and is not a promise of future results. All investing and trading includes risk, including the possible loss of principal. Always do your own review, think about your personal financial situation and risk tolerance, and talk with a qualified financial advisor before making any investment choices.