
The search for high-growth stocks often involves a blend of technical and fundamental analysis, aiming to identify companies that are not only in a strong price uptrend but also show accelerating business momentum. One systematic approach to this is inspired by the method of trader Mark Minervini, which combines his Trend Template for technical strength with filters for strong fundamental growth. This strategy aims to find stocks that are market leaders, trading in strong uptrends, and supported by significant improvements in earnings, sales, and profitability. A stock that recently appeared through such a combined screen is Harmony Gold Mining Co. Ltd. (NYSE:HMY).
Technical Strength: Following the Minervini Trend Template
The Minervini Trend Template is a strict set of technical criteria made to filter for stocks in a confirmed and strong Stage 2 uptrend. Harmony Gold's current chart and metrics show a strong alignment with these rules, which are important for identifying stocks with institutional support and positive momentum.
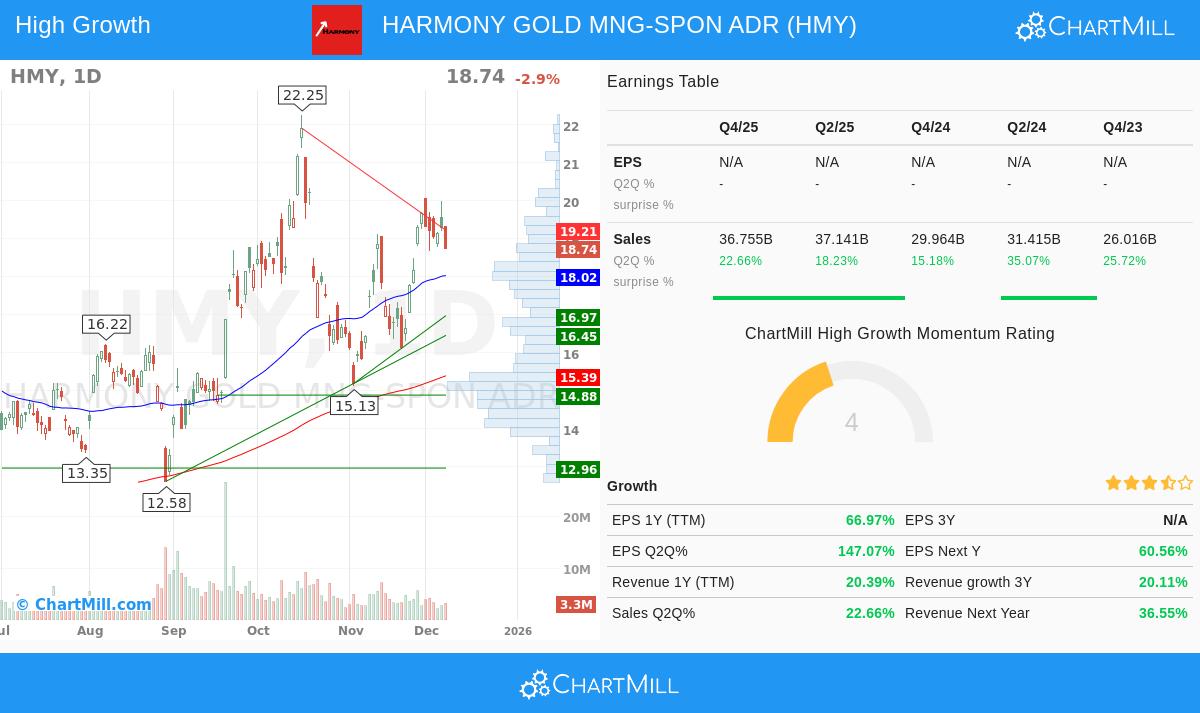
- Price Above Key Moving Averages: The stock's last price of $18.74 trades well above its rising 50-day ($18.02), 150-day ($15.94), and 200-day ($15.39) simple moving averages (SMAs). This stacked order shows sustained buying pressure across short, intermediate, and long-term timeframes.
- Moving Average Order: The 50-day SMA is above both the 150-day and 200-day SMAs, while the 150-day SMA is also above the 200-day SMA. This sequential positive order confirms a strong and established uptrend.
- Proximity to Highs: At $18.74, HMY is trading within 16% of its 52-week high of $22.25, meeting the template's requirement of being within 25% of the high. At the same time, the price is over 135% above its 52-week low of $7.97, far exceeding the 30% level. This shows significant recovery strength and places the stock as a leader, not a laggard.
- Superior Relative Strength: With a ChartMill Relative Strength (CRS) score of 95.13, HMY performs better than about 95% of all stocks in the market over the past year. High relative strength is a key part of the Minervini approach, as it identifies stocks that are leading the market higher, often a sign of institutional accumulation.
This technical view is further supported by the stock's perfect ChartMill Technical Rating of 10, showing exceptional overall technical health. The long-term and short-term trends are both rated as positive, strengthening the Stage 2 uptrend story essential for this strategy.
Fundamental Momentum: Qualifying for High Growth
While the Trend Template ensures a stock is technically sound, the "High Growth Momentum" part of the screen aims to confirm that the price strength is supported by improving business fundamentals. Harmony Gold shows several key metrics that signal accelerating operational and financial performance, a requirement for sustainable high-growth investing.
- Strong Earnings Growth: The company's trailing twelve-month (TTM) EPS has grown by about 67% year-over-year. More notably, the growth in the most recent quarter compared to the same quarter last year rose by over 147%. This acceleration in profitability is a main driver for high-growth investors.
- Strong and Improving Profitability: The company's profit margin in the last reported quarter was a solid 21.2%, a meaningful increase from 8.9% two quarters before. This trend of growing margins shows operational efficiency and pricing ability, which can lead to exponential earnings growth as revenue increases.
- Solid Revenue Expansion: Revenue growth is also healthy, with TTM sales up over 20% and the latest quarterly sales growing by nearly 23% year-over-year. This top-line growth provides a firm base for the bottom-line expansion.
- Positive Analyst Revisions: The average analyst estimate for next year's EPS has been moved upward by 12% over the last three months, while revenue estimates have been moved up by nearly 11%. Upward revisions often come before further price appreciation as they show growing confidence in the company's future prospects.
These fundamental factors, accelerating earnings, growing margins, solid revenue growth, and positive estimate revisions, create the "catalyst" that Minervini's SEPA (Specific Entry Point Analysis) method looks for. They provide the fundamental reason behind the technical breakout, suggesting the momentum is built on a base of real business improvement.
Technical Analysis Summary and Considerations
A review of the detailed technical report for HMY summarizes its position well: the stock scores a perfect 10 on technical health, benefiting from strong relative strength and positive trends across all timeframes. The report notes multiple established support zones below the current price, with the nearest significant support grouped around the $16.12 to $16.97 area. Resistance is seen in the $18.96 to $19.21 zone, which the stock is currently testing.
A key point from the analysis is that while HMY's technical rating is excellent, its Setup Quality score is currently low (3). This shows that after a strong upward move, the stock is in a phase of higher volatility and has not yet formed a tight, low-volatility consolidation pattern that would offer a classic, low-risk entry point. For traders strictly following Minervini's rules, this suggests a period of careful waiting for a proper "volatility contraction pattern" (VCP) to form before considering a new entry.
Conclusion
Harmony Gold Mining presents a strong case study of a stock that aligns with a high-growth momentum strategy filtered through a strict technical lens. It meets the strict criteria of the Minervini Trend Template, confirming its status as a stock in a strong uptrend with superior market-relative strength. Furthermore, its fundamental profile shows the kind of accelerating earnings growth, margin expansion, and positive analyst sentiment that high-growth investors look for to justify and maintain such a price advance.
While the current technical setup may be extended, the combination of factors makes HMY a stock worthy of inclusion on a watchlist for those following this method. Investors interested in finding similar candidates that blend strong technical trends with high-growth fundamentals can examine the screen that identified HMY.
Find more stocks that meet the High Growth Momentum + Trend Template criteria by using this pre-configured screen on ChartMill.
Disclaimer: This article is for informational and educational purposes only. It is not a recommendation to buy or sell any security. The analysis is based on data provided and certain methodological frameworks. All investing and trading involves risk, including the potential loss of principal. Always conduct your own thorough research and consider your financial situation and risk tolerance before making any investment decisions. Please read our full disclaimer and terms of use for more information.