
For investors looking to mix strict technical rules with an emphasis on fundamental growth, a method combining Mark Minervini’s Trend Template with a High Growth Momentum (HGM) screen presents a strong structure. This method first finds stocks showing the clean technical traits of a steady uptrend, like ordered moving averages, high relative strength, and closeness to new highs, as set by Minervini’s system. It then adds a need for solid fundamental momentum, looking for companies with quickening earnings, sales growth, and favorable analyst changes. The aim is to find leading stocks that are not only set technically for their trend to keep going but are also supported by the strong fundamental driver that usually powers top performance. One stock now clearing this two-step screen is HCI Group Inc (NYSE:HCI).
Technical Fit with the Minervini Trend Template
A central idea of the Minervini method is to trade in the direction of clear strength, steering clear of the risky attempt to buy during a decline. The Trend Template gives a clear, yes-or-no list to confirm a stock is in a definite Stage 2 advance before it is reviewed. HCI Group’s present chart shows a good fit with these technical needs.
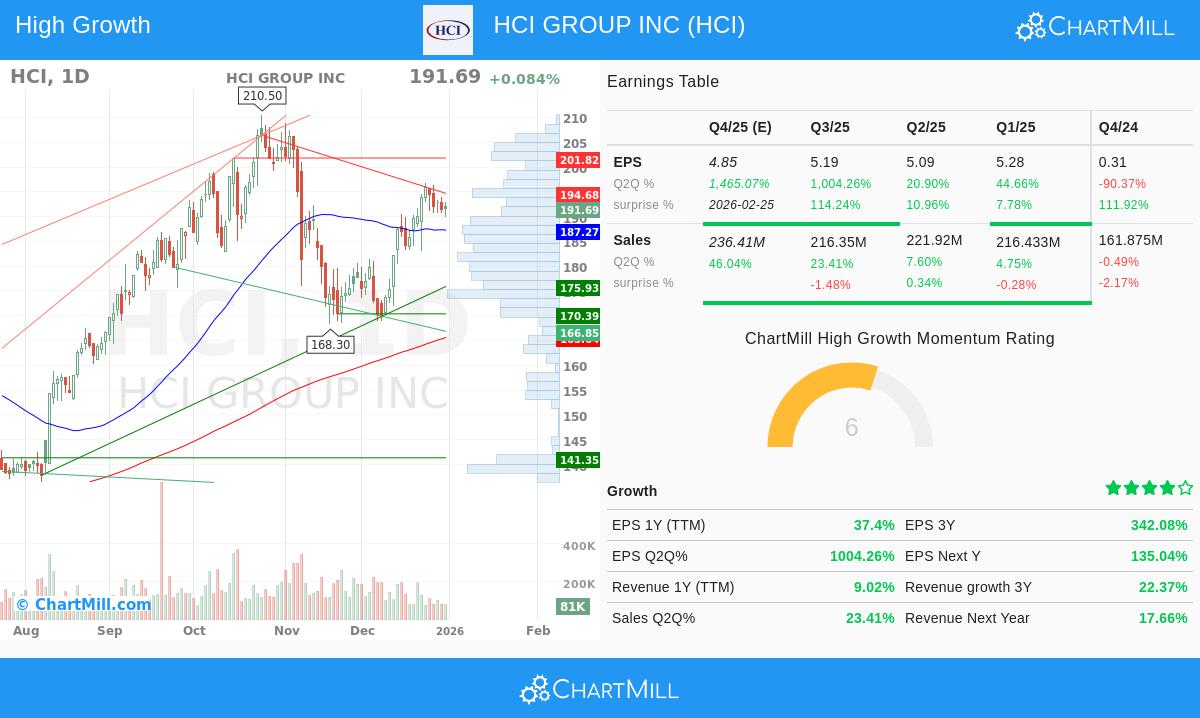
- Ordered Moving Averages: The stock price is above all main simple moving averages (SMAs)—the 50-day ($187.27), 150-day ($171.02), and 200-day ($165.64). Importantly, the longer 200-day SMA is moving up, confirming a good long-term direction. This order shows buyers are dominant across different periods.
- Closeness to Highs: Minervini’s work shows that real market leaders often reach new highs, not bounce from large lows. HCI’s present price is within 25% of its 52-week high of $210.50 and, more notably, is a full 77% above its 52-week low of $108.26. This fits the template's need to be at least 30% above the yearly low, showing good recovery speed and a place of strength.
- High Relative Strength: A stock’s action compared to the wider market is a main sign of institutional interest. HCI has a ChartMill Relative Strength (CRS) score of 92.06, meaning it has done better than 92% of all stocks over the past year. This outstanding relative strength is a mark of leadership and meets Minervini’s choice for stocks with a CRS above 70, preferably in the 80s or 90s.
This technical view indicates HCI is not in a temporary rise but is inside an organized, long-term positive trend, making it a valid pick for the next phase in the review: checking its fundamental growth driver.
Fundamental Momentum for Growth Investors
While the Trend Template confirms a stock is in the correct technical "stage," the High Growth Momentum (HGM) score aims to show why it might be there and if the speed can last. The HGM score measures quickening in earnings, sales, and profit margins, plus analyst opinion. HCI’s given numbers show several strong fundamental triggers.
- Strong Earnings Quickening: The newest quarterly earnings growth is very high, with EPS jumping over 1000% year-over-year. While this is partially from a low base period, the direction stays clearly positive. Also, analysts are greatly increasing their estimates, with the average EPS forecast for the next year raised by over 23% in just the last three months. This habit of surpassing forecasts and getting raised estimates is a clear signal Minervini calls a fundamental "trigger" that draws institutional purchases.
- Good Sales Growth and Growing Margins: Revenue growth has become clearly positive, with the latest quarter showing a 23.4% year-over-year gain. This is being turned effectively into profits, shown by a solid quarterly profit margin of about 29.3%. The growth of profit margins shows pricing control and operational effectiveness, main features of companies able to maintain top performance.
- Steady Results: The company has surpassed EPS estimates in all of the last four quarters, with an average beat of over 61%. This steadiness in beating forecasts builds trust with investors and can create a repeating cycle of positive feeling and purchase demand.
These fundamental points give the "reason" behind the chart. They suggest HCI’s technical breakout and good trend are backed by real, improving business results, which is needed for the move to last longer than a simple speculative rise.
Technical Condition and Setup Summary
Bringing the technical view into one, HCI Group gets a nearly perfect ChartMill Technical Rating of 9 out of 10, showing its very good overall technical condition. The long-term and short-term trends are both scored as positive, and the stock is a top performer in the Insurance industry. The related technical report notes a reasonable setup pattern, with prices settling in a range between about $169 and $197 after its good rise. This settling has brought lower volatility, which can sometimes come before the next price move. The report finds a main resistance area just above the present price, around $191.79 to $194.68. A clear move above this area could signal the restart of the uptrend and offer a possible entry point as described by Minervini’s focus on certain pivot points.
For a full look at the support and resistance levels, volume study, and a specific trade setup example, you can see the complete ChartMill Technical Analysis Report for HCI.
Finding Like Opportunities
HCI Group acts as a real example of a stock that now fits a strict growth-and-momentum method. For investors wanting to use this same two-step way to find other possible choices, the preset screen that found HCI is ready to use. This screen methodically uses the Minervini Trend Template needs along with the High Growth Momentum filter, searching the market for other stocks that show both technical exactness and fundamental quickening.
You can find more stocks that meet these combined needs by using this High Growth Momentum + Trend Template screen.
Disclaimer: This article is for informational and educational purposes only. It is not a recommendation to buy or sell any security. The analysis is based on current data and a specific investment methodology. All investing involves risk, including the potential loss of principal. Always conduct your own due diligence, consider your financial situation and risk tolerance, and consult with a qualified financial advisor before making any investment decisions.