
HCA HEALTHCARE INC (NYSE:HCA) has been identified as a Technical Breakout Setup Pattern by our stock screener. This pattern typically occurs when a stock takes a pause after a significant rise, indicating the possibility of a continuation in the trend. While it's impossible to predict with certainty, it might be beneficial to monitor NYSE:HCA.
Technical Analysis Observations
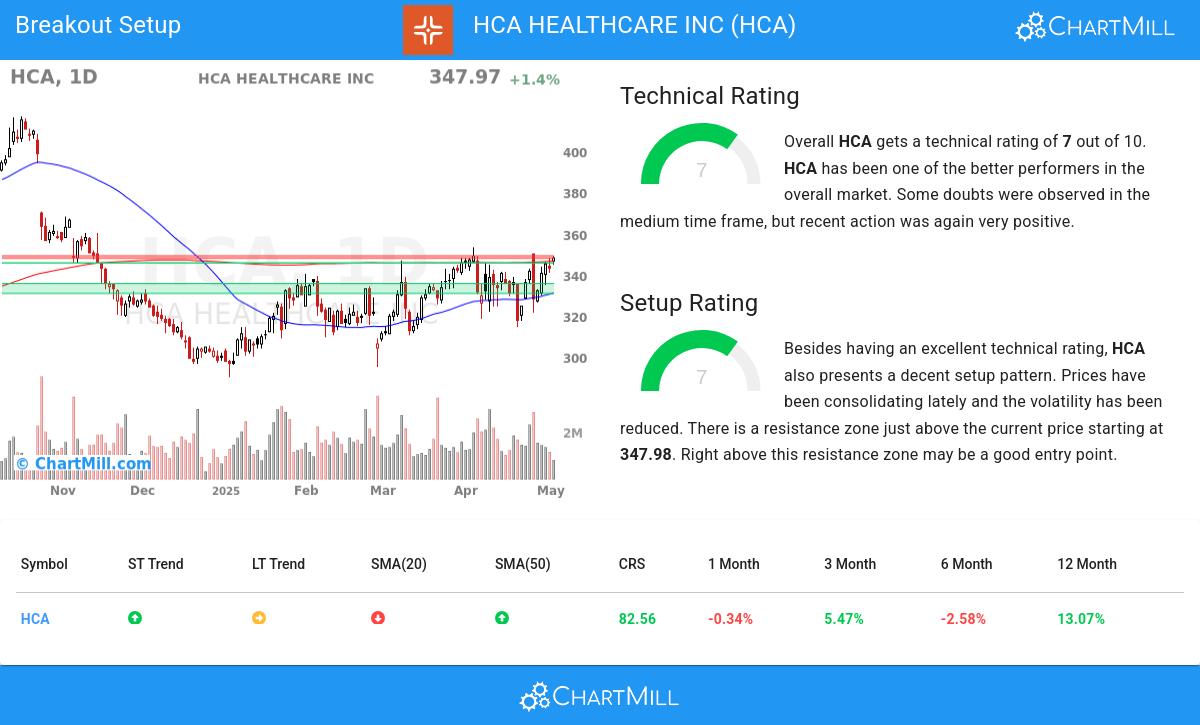
ChartMill assigns a proprietary Technical Rating to each stock. The score is computed daily by evaluating various technical indicators and properties. The score ranges from 0 to 10.
Overall HCA gets a technical rating of 7 out of 10. In the last year, HCA was one of the better performers in the market. There are positive signs in the very recent evolution, but the medium term picture is slightly mixed.
- The long term trend is still neutral, but the short term trend is positive, so the stock is getting more and more appreciated by traders and investors.
- In the last month HCA has a been trading in the 314.43 - 350.25 range, which is quite wide. It is currently trading near the high of this range.
- When comparing the yearly performance of all stocks, we notice that HCA is one of the better performing stocks in the market, outperforming 82% of all stocks. However, this overall performance is mostly based on the strong move around 10 months ago.
- HCA is part of the Health Care Providers & Services industry. There are 102 other stocks in this industry, HCA did better than 69% of them.
- HCA is currently trading in the middle of its 52 week range. This is in line with the S&P500 Index, which is also trading in the middle of its range.
- Prices have been rising strongly lately, it may be a good idea to wait for a consolidation or pullback before considering an entry.
Check the latest full technical report of HCA for a complete technical analysis.
How does the Setup look for HCA
In addition to the Technical Rating, ChartMill provides a Setup Rating for each stock. This rating, ranging from 0 to 10, assesses the extent of consolidation in the stock based on multiple short-term technical indicators. Currently, HCA has a 7 as its setup rating:
HCA has an excellent technical rating and also presents a decent setup pattern. Prices have been consolidating lately and the volatility has been reduced. There is a resistance zone just above the current price starting at 347.98. Right above this resistance zone may be a good entry point.
How to trade HCA?
One way to play this would be to wait for the actual breakout to happen and buy when the stock breaks out above the current consolidation zone. A possible place for a stop loss would be below this zone.
Please note that this article should not be construed as trading advice. The information provided is solely based on automated technical analysis and serves to highlight technical observations. It is important to conduct your own analysis and make trading decisions based on your own judgment and responsibility.
Our Breakout screener lists more breakout setups and is updated daily.
Disclaimer
Important Note: The content of this article is not intended as trading advice. It is essential to perform your own analysis and exercise caution when making trading decisions. The article presents observations created by automated analysis but does not guarantee any trading or investment outcomes. Always trade responsibly and make independent judgments.

