
In growth investing, joining a strict technical system with attention to fundamental momentum can be an effective method. The system used here comes from the ideas of Mark Minervini’s SEPA (Specific Entry Point Analysis) plan, which works to spot market leaders early in their big price rises. This uses a two-step screen: first, a stock must clear the strict technical list called the Minervini Trend Template, proving it is in a solid, confirmed uptrend. Second, it must show the fundamental traits of a fast-growth company, as seen by measures like speeding earnings, strong sales growth, and favorable analyst changes. This two-part method works to locate firms that are not only technically set for a price change but also have the core business momentum to keep it going.
Halozyme Therapeutics Inc (NASDAQ:HALO) offers a strong example for this joined plan. The biopharmaceutical technology platform firm, recognized for its ENHANZE drug delivery technology, seems to match both the technical rules and growth-focused fundamentals that this system values.
Technical Match with the Minervini Trend Template
The center of Minervini’s technical method is to trade in the direction of the strongest momentum, staying away from bargain searches in favor of stocks showing clear force. HALO’s present chart position meets the important points of the Trend Template:
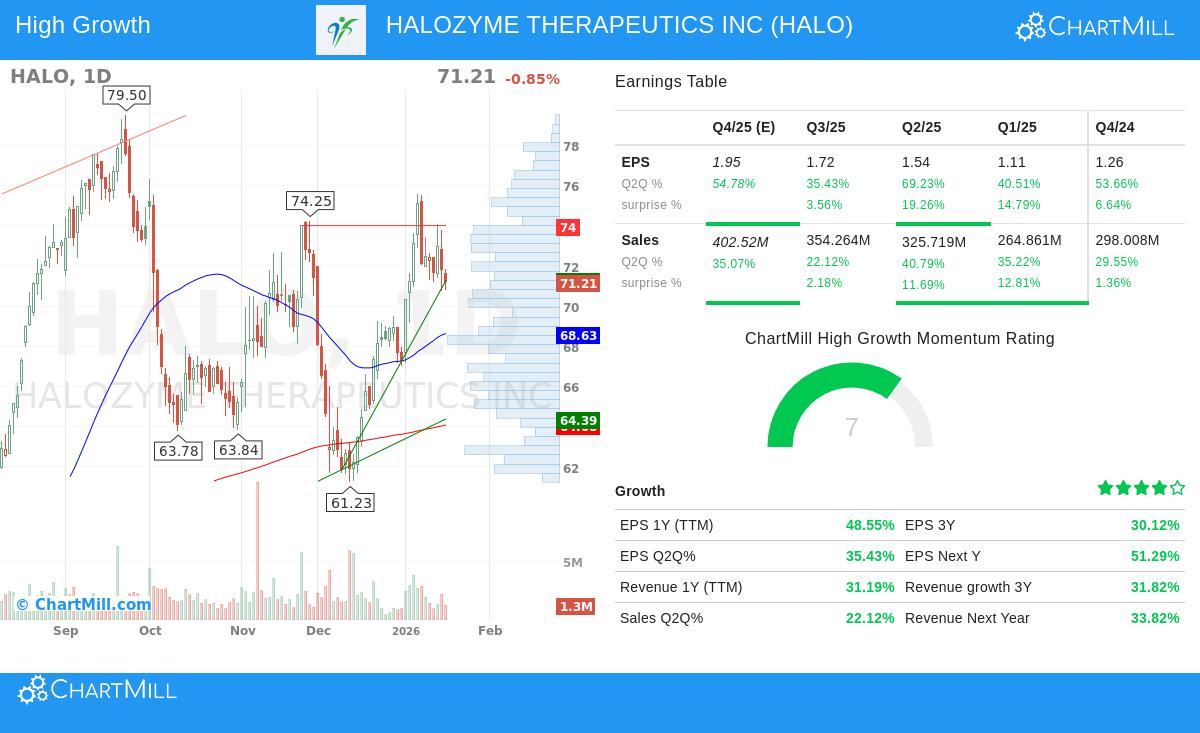
- Price Above Key Moving Averages: The stock trades above its rising 50-day, 150-day, and 200-day simple moving averages (SMAs). This order points to continued buying pressure across short, intermediate, and long-term periods.
- Moving Average Order: The 50-day SMA ($68.63) is above both the 150-day ($66.22) and 200-day ($64.08) SMAs, while the 150-day SMA is also above the 200-day. This layered, rising arrangement is a standard sign of a sound Stage 2 rise.
- Nearness to Highs: With a present price near $71.21, HALO is trading within 25% of its 52-week high of $79.50 and stands about 50% above its 52-week low of $47.50. This fits the template's rules of focusing on force, stocks near highs often show leader traits.
- Strong Relative Strength: A ChartMill Relative Strength (CRS) score of 78.92 shows HALO is doing better than nearly 79% of all stocks in the market over the past year. High relative strength is a key part of the Minervini idea, as it spots sector leaders before they are clear to the wider market.
This technical view indicates HALO is in a confirmed uptrend, meeting the "trend" part of the SEPA plan and giving a positive setting for more study.
Fundamental Picture for Fast-Growth Momentum
While the Trend Template makes sure a stock is technically sound, the High Growth Momentum (HGM) filter works to confirm that force with core business results. For growth investors, speeding earnings and sales are often the drivers that push continued price gains. HALO’s fundamental measures show several good directions:
- Earnings Growth and Speed: The company shows notable year-over-year earnings growth. EPS (TTM) grew about 48.5%, and recent quarterly growth has been strong, with the last reported quarter up 35.4% and the quarter before up 69.2%. This shape of solid, and in some times speeding, bottom-line growth is a main feature looked for by growth investors.
- Steady Earnings Surprises: HALO has topped analyst EPS estimates in each of the last four quarters, with an average beat of over 11%. Steady positive surprises can push upward changes and fresh institutional interest.
- Sound Revenue Growth: Top-line growth is also clear, with TTM revenue up over 31%. Recent quarterly sales growth numbers of 22.1% (last quarter) and 40.8% (prior quarter) point to continued commercial momentum for its platform technology.
- Solid and Growing Profitability: Maybe most significantly, HALO keeps outstanding profit margins. The last quarter reported a net profit margin of nearly 49.5%, and the full-year FY margin was 43.7%. High and growing margins show pricing force and scalable business models, which are signs of winning growth companies.
- Favorable Analyst View: The average estimate for next year’s EPS has been changed upward by about 1.77% over the last three months, hinting at increasing analyst belief in the company’s forward path.
These fundamental items address the "fundamentals" and "catalyst" parts of the SEPA plan, indicating the technical breakout is backed by bettering business performance.
Technical Condition and Setup Summary
ChartMill’s own technical report gives HALO a high score of 9 out of 10, noting the stock is in a positive long-term and short-term trend and has been a market outperformer. The report also spots the stock as presently forming a possible "bull flag" shape, a pause or small pullback within an uptrend that may give a planned entry point. Key support levels are spotted in the $64.29-$64.39 and $61.87-$62.21 areas, which could act as logical zones for risk control.
For a full look at the technical indicators, support and resistance levels, and the complete study, readers can see the full technical report for HALO.
Conclusion
Halozyme Therapeutics Inc shows the kind of security that a joined technical and fundamental growth system works to spot. It clears the strict technical filters of the Minervini Trend Template, confirming its place in a solid market uptrend. At the same time, its fundamental picture, marked by solid earnings growth, high profitability, and positive revenue directions, fits the rules for fast-growth momentum investing. This joining indicates the stock’s price force may be supported by real business performance, a mix that growth-focused traders often find strong.
Interested in finding more stocks that fit this High Growth Momentum + Trend Template picture? You can look at the preset screen and its present results here.
Disclaimer: This article is for information and learning only and is not meant as investment advice. The study does not form a suggestion to buy, sell, or hold any security. Investors should do their own full check and talk with a qualified financial advisor before making any investment choices. Past results are not a guide for future results.