
Our stock screening tool has pinpointed HALOZYME THERAPEUTICS INC (NASDAQ:HALO) as an undervalued stock. HALO maintains a solid financial footing. Furthermore, it remains attractively priced. Let's delve into the specifics below.
Looking at the Valuation
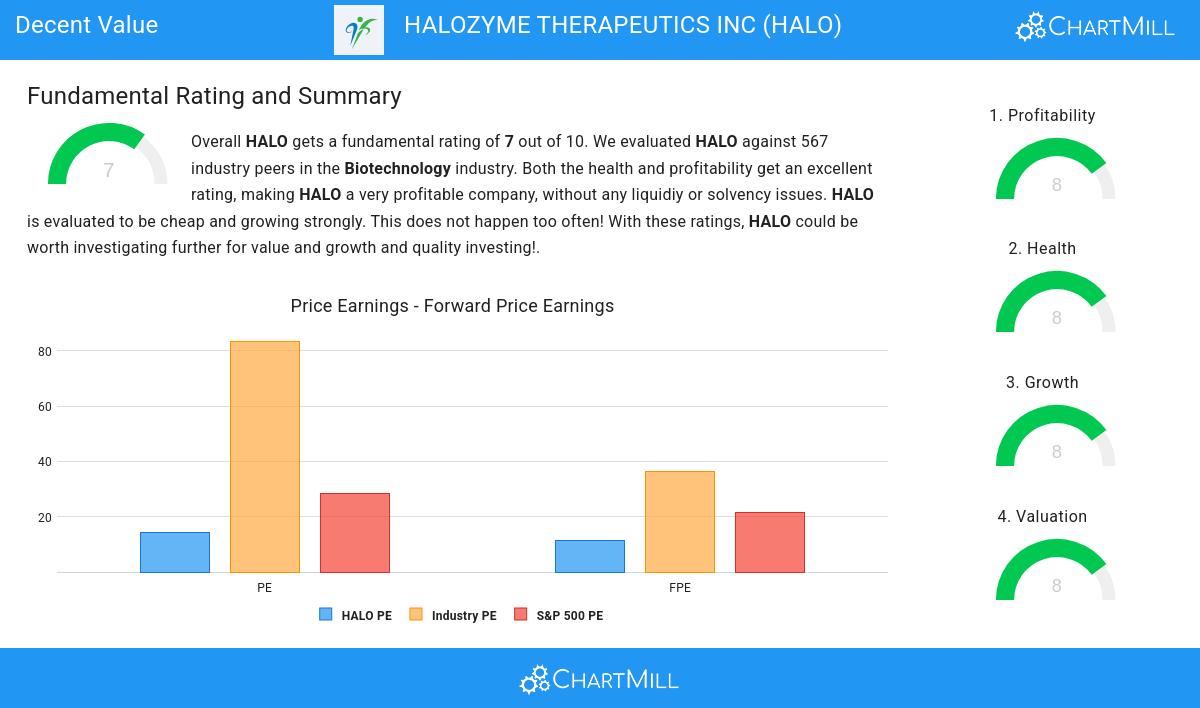
ChartMill assigns a Valuation Rating to each stock, ranging from 0 to 10. This rating is calculated by analyzing different valuation elements, such as price to earnings and free cash flow, both in absolute terms and relative to the market and industry. In the case of HALO, the assigned 8 reflects its valuation:
- Based on the Price/Earnings ratio, HALO is valued cheaply inside the industry as 97.18% of the companies are valued more expensively.
- HALO is valuated rather cheaply when we compare the Price/Earnings ratio to 28.56, which is the current average of the S&P500 Index.
- With a Price/Forward Earnings ratio of 11.56, the valuation of HALO can be described as very reasonable.
- HALO's Price/Forward Earnings ratio is rather cheap when compared to the industry. HALO is cheaper than 96.83% of the companies in the same industry.
- HALO is valuated rather cheaply when we compare the Price/Forward Earnings ratio to 21.44, which is the current average of the S&P500 Index.
- Based on the Enterprise Value to EBITDA ratio, HALO is valued cheaply inside the industry as 96.12% of the companies are valued more expensively.
- Compared to the rest of the industry, the Price/Free Cash Flow ratio of HALO indicates a rather cheap valuation: HALO is cheaper than 96.12% of the companies listed in the same industry.
- HALO's low PEG Ratio(NY), which compensates the Price/Earnings for growth, indicates a rather cheap valuation of the company.
- HALO has an outstanding profitability rating, which may justify a higher PE ratio.
- A more expensive valuation may be justified as HALO's earnings are expected to grow with 24.24% in the coming years.
Profitability Analysis for HALO
ChartMill assigns a proprietary Profitability Rating to each stock. The score is computed by evaluating various profitability ratios and margins and ranges from 0 to 10. HALO was assigned a score of 8 for profitability:
- Looking at the Return On Assets, with a value of 21.52%, HALO belongs to the top of the industry, outperforming 98.94% of the companies in the same industry.
- The Return On Equity of HALO (122.06%) is better than 99.47% of its industry peers.
- The Return On Invested Capital of HALO (23.00%) is better than 99.12% of its industry peers.
- Measured over the past 3 years, the Average Return On Invested Capital for HALO is above the industry average of 13.94%.
- The last Return On Invested Capital (23.00%) for HALO is above the 3 year average (17.81%), which is a sign of increasing profitability.
- HALO has a better Profit Margin (43.74%) than 99.12% of its industry peers.
- HALO has a Operating Margin of 54.32%. This is amongst the best in the industry. HALO outperforms 99.82% of its industry peers.
- With an excellent Gross Margin value of 84.30%, HALO belongs to the best of the industry, outperforming 86.95% of the companies in the same industry.
- In the last couple of years the Gross Margin of HALO has grown nicely.
Evaluating Health: HALO
A critical element of ChartMill's stock evaluation is the Health Rating, which spans from 0 to 10. This rating considers multiple health factors, including liquidity and solvency, both in absolute terms and relative to industry peers. HALO has received a 8 out of 10:
- An Altman-Z score of 4.81 indicates that HALO is not in any danger for bankruptcy at the moment.
- The Altman-Z score of HALO (4.81) is better than 82.19% of its industry peers.
- The Debt to FCF ratio of HALO is 3.21, which is a good value as it means it would take HALO, 3.21 years of fcf income to pay off all of its debts.
- HALO has a better Debt to FCF ratio (3.21) than 94.00% of its industry peers.
- HALO has a Current Ratio of 7.80. This indicates that HALO is financially healthy and has no problem in meeting its short term obligations.
- Looking at the Current ratio, with a value of 7.80, HALO is in the better half of the industry, outperforming 73.37% of the companies in the same industry.
- HALO has a Quick Ratio of 6.78. This indicates that HALO is financially healthy and has no problem in meeting its short term obligations.
- Looking at the Quick ratio, with a value of 6.78, HALO is in the better half of the industry, outperforming 68.25% of the companies in the same industry.
How We Gauge Growth for HALO
ChartMill assigns a Growth Rating to each stock, ranging from 0 to 10. This rating is determined by analyzing different growth elements, including EPS and revenue growth, spanning both historical and future figures. In the case of HALO, the assigned 8 reflects its growth potential:
- HALO shows a strong growth in Earnings Per Share. In the last year, the EPS has been growing by 52.16%, which is quite impressive.
- HALO shows a strong growth in Earnings Per Share. Measured over the last years, the EPS has been growing by 30.12% yearly.
- Looking at the last year, HALO shows a very strong growth in Revenue. The Revenue has grown by 22.46%.
- Measured over the past years, HALO shows a very strong growth in Revenue. The Revenue has been growing by 38.95% on average per year.
- The Earnings Per Share is expected to grow by 15.65% on average over the next years. This is quite good.
- HALO is expected to show quite a strong growth in Revenue. In the coming years, the Revenue will grow by 11.45% yearly.
Every day, new Decent Value stocks can be found on ChartMill in our Decent Value screener.
Our latest full fundamental report of HALO contains the most current fundamental analsysis.
Keep in mind
This article should in no way be interpreted as advice. The article is based on the observed metrics at the time of writing, but you should always make your own analysis and trade or invest at your own responsibility.