
Uncover the hidden value in HAEMONETICS CORP/MASS (NYSE:HAE) as our stock screening tool recommends it as an undervalued choice. NYSE:HAE maintains a robust financial position and offers an attractive pricing perspective. Let's dig deeper into the analysis.
Valuation Assessment of NYSE:HAE
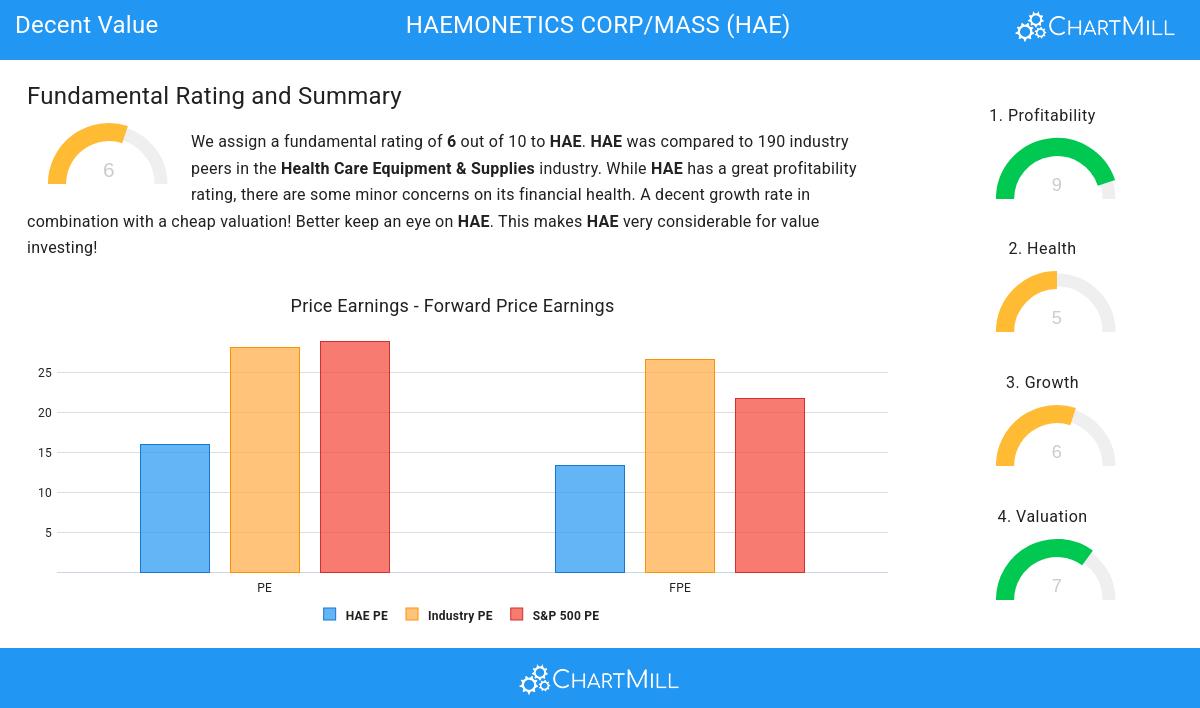
ChartMill assigns a Valuation Rating to each stock, ranging from 0 to 10. This rating is calculated by analyzing different valuation elements, such as price to earnings and free cash flow, both in absolute terms and relative to the market and industry. In the case of NYSE:HAE, the assigned 7 reflects its valuation:
- 89.47% of the companies in the same industry are more expensive than HAE, based on the Price/Earnings ratio.
- HAE's Price/Earnings ratio indicates a valuation a bit cheaper than the S&P500 average which is at 28.93.
- Compared to the rest of the industry, the Price/Forward Earnings ratio of HAE indicates a rather cheap valuation: HAE is cheaper than 93.68% of the companies listed in the same industry.
- The average S&P500 Price/Forward Earnings ratio is at 21.69. HAE is valued slightly cheaper when compared to this.
- HAE's Enterprise Value to EBITDA ratio is rather cheap when compared to the industry. HAE is cheaper than 88.42% of the companies in the same industry.
- Compared to the rest of the industry, the Price/Free Cash Flow ratio of HAE indicates a somewhat cheap valuation: HAE is cheaper than 75.79% of the companies listed in the same industry.
- The excellent profitability rating of HAE may justify a higher PE ratio.
- A more expensive valuation may be justified as HAE's earnings are expected to grow with 13.53% in the coming years.
What does the Profitability looks like for NYSE:HAE
ChartMill assigns a proprietary Profitability Rating to each stock. The score is computed by evaluating various profitability ratios and margins and ranges from 0 to 10. NYSE:HAE was assigned a score of 9 for profitability:
- Looking at the Return On Assets, with a value of 5.14%, HAE belongs to the top of the industry, outperforming 85.26% of the companies in the same industry.
- With an excellent Return On Equity value of 14.34%, HAE belongs to the best of the industry, outperforming 89.47% of the companies in the same industry.
- HAE's Return On Invested Capital of 7.64% is amongst the best of the industry. HAE outperforms 84.74% of its industry peers.
- The last Return On Invested Capital (7.64%) for HAE is above the 3 year average (7.51%), which is a sign of increasing profitability.
- HAE's Profit Margin of 9.47% is amongst the best of the industry. HAE outperforms 83.68% of its industry peers.
- HAE's Profit Margin has improved in the last couple of years.
- The Operating Margin of HAE (15.93%) is better than 86.84% of its industry peers.
- In the last couple of years the Operating Margin of HAE has grown nicely.
- HAE's Gross Margin has improved in the last couple of years.
A Closer Look at Health for NYSE:HAE
A critical element of ChartMill's stock evaluation is the Health Rating, which spans from 0 to 10. This rating considers multiple health factors, including liquidity and solvency, both in absolute terms and relative to industry peers. NYSE:HAE has received a 5 out of 10:
- HAE has a Altman-Z score of 2.65. This is in the better half of the industry: HAE outperforms 64.74% of its industry peers.
- HAE's Debt to FCF ratio of 14.71 is fine compared to the rest of the industry. HAE outperforms 71.05% of its industry peers.
- A Current Ratio of 3.97 indicates that HAE has no problem at all paying its short term obligations.
- Looking at the Current ratio, with a value of 3.97, HAE is in the better half of the industry, outperforming 68.42% of the companies in the same industry.
- A Quick Ratio of 2.55 indicates that HAE has no problem at all paying its short term obligations.
Understanding NYSE:HAE's Growth Score
ChartMill employs its own Growth Rating system for all stocks. This score, ranging from 0 to 10, is derived by evaluating different growth factors, such as EPS and revenue growth, taking into account both past performance and future projections. NYSE:HAE has earned a 6 for growth:
- HAE shows a strong growth in Earnings Per Share. In the last year, the EPS has been growing by 9.87%, which is quite good.
- The Earnings Per Share has been growing by 10.74% on average over the past years. This is quite good.
- HAE shows quite a strong growth in Revenue. In the last year, the Revenue has grown by 8.14%.
- Based on estimates for the next years, HAE will show a quite strong growth in Earnings Per Share. The EPS will grow by 17.65% on average per year.
- Based on estimates for the next years, HAE will show a quite strong growth in Revenue. The Revenue will grow by 8.79% on average per year.
- The EPS growth rate is accelerating: in the next years the growth will be better than in the last years.
- When comparing the Revenue growth rate of the last years to the growth rate of the upcoming years, we see that the growth is accelerating.
Our Decent Value screener lists more Decent Value stocks and is updated daily.
For an up to date full fundamental analysis you can check the fundamental report of HAE
Disclaimer
This article should in no way be interpreted as advice. The article is based on the observed metrics at the time of writing, but you should always make your own analysis and trade or invest at your own responsibility.