
Our stock screening tool has pinpointed GRANITE CONSTRUCTION INC (NYSE:GVA) as an undervalued stock option. GVA retains a strong financial foundation and an attractive price tag. Let's delve into the specifics below.
A Closer Look at Valuation for GVA
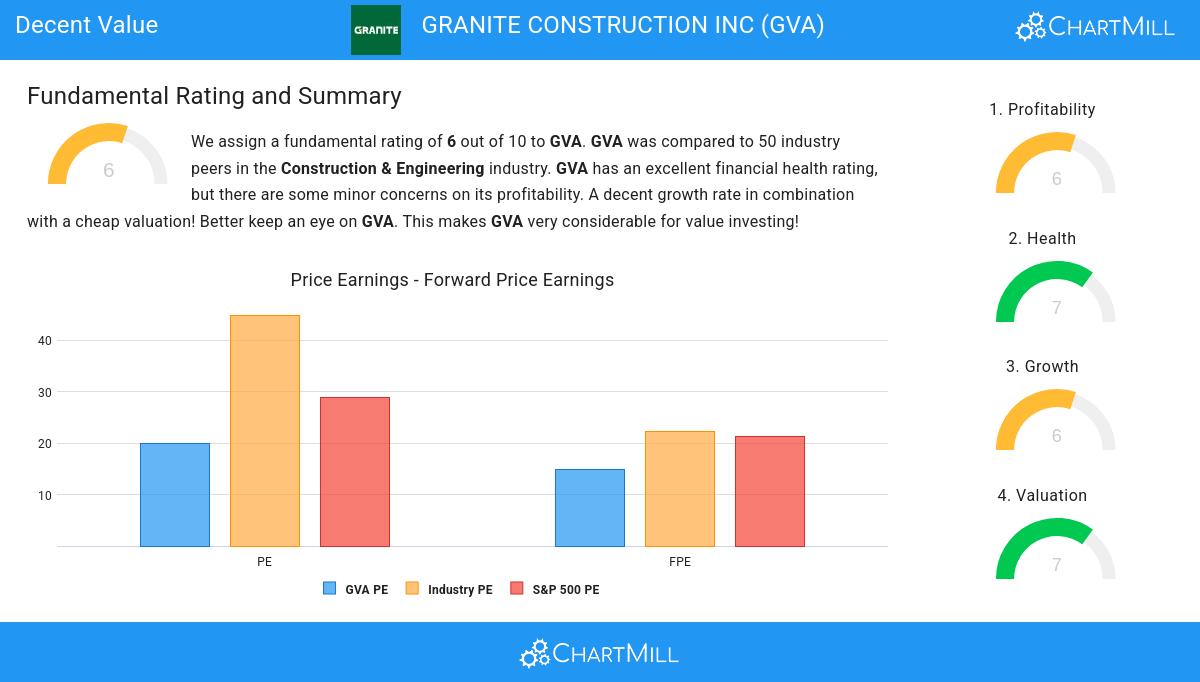
ChartMill assigns a Valuation Rating to each stock, ranging from 0 to 10. This rating is calculated by analyzing different valuation elements, such as price to earnings and free cash flow, both in absolute terms and relative to the market and industry. In the case of GVA, the assigned 7 reflects its valuation:
- 72.00% of the companies in the same industry are more expensive than GVA, based on the Price/Earnings ratio.
- Compared to an average S&P500 Price/Earnings ratio of 28.98, GVA is valued a bit cheaper.
- Compared to the rest of the industry, the Price/Forward Earnings ratio of GVA indicates a somewhat cheap valuation: GVA is cheaper than 78.00% of the companies listed in the same industry.
- When comparing the Price/Forward Earnings ratio of GVA to the average of the S&P500 Index (21.38), we can say GVA is valued slightly cheaper.
- 82.00% of the companies in the same industry are more expensive than GVA, based on the Enterprise Value to EBITDA ratio.
- Based on the Price/Free Cash Flow ratio, GVA is valued cheaply inside the industry as 84.00% of the companies are valued more expensively.
- The low PEG Ratio(NY), which compensates the Price/Earnings for growth, indicates a rather cheap valuation of the company.
- The decent profitability rating of GVA may justify a higher PE ratio.
- GVA's earnings are expected to grow with 21.98% in the coming years. This may justify a more expensive valuation.
Understanding GVA's Profitability
ChartMill's Profitability Rating offers a unique perspective on stock analysis, providing scores from 0 to 10. These ratings consider a wide range of profitability metrics and margins, both in comparison to industry peers and on their own merits. For GVA, the assigned 6 is a significant indicator of profitability:
- Looking at the Return On Assets, with a value of 4.18%, GVA is in the better half of the industry, outperforming 62.00% of the companies in the same industry.
- The Return On Equity of GVA (12.45%) is better than 64.00% of its industry peers.
- The last Return On Invested Capital (6.03%) for GVA is above the 3 year average (3.67%), which is a sign of increasing profitability.
- In the last couple of years the Profit Margin of GVA has grown nicely.
- In the last couple of years the Gross Margin of GVA has grown nicely.
Looking at the Health
Every stock is evaluated by ChartMill, receiving a Health Rating on a scale of 0 to 10. This assessment considers different health aspects, including liquidity and solvency, both in absolute terms and relative to industry peers. GVA has achieved a 7 out of 10:
- An Altman-Z score of 3.14 indicates that GVA is not in any danger for bankruptcy at the moment.
- GVA has a Altman-Z score of 3.14. This is in the better half of the industry: GVA outperforms 64.00% of its industry peers.
- GVA has a debt to FCF ratio of 2.31. This is a good value and a sign of high solvency as GVA would need 2.31 years to pay back of all of its debts.
- The Debt to FCF ratio of GVA (2.31) is better than 70.00% of its industry peers.
- Even though the debt/equity ratio score it not favorable for GVA, it has very limited outstanding debt, so we won't put too much weight on the DE evaluation.
- With an excellent Current ratio value of 1.66, GVA belongs to the best of the industry, outperforming 82.00% of the companies in the same industry.
- With an excellent Quick ratio value of 1.56, GVA belongs to the best of the industry, outperforming 82.00% of the companies in the same industry.
Growth Assessment of GVA
To evaluate a stock's growth potential, ChartMill utilizes a Growth Rating on a scale of 0 to 10. This comprehensive assessment considers various growth aspects, including historical and estimated EPS and revenue growth. GVA has achieved a 6 out of 10:
- The Earnings Per Share has grown by an impressive 29.07% over the past year.
- Measured over the past years, GVA shows a very strong growth in Earnings Per Share. The EPS has been growing by 32.75% on average per year.
- Looking at the last year, GVA shows a quite strong growth in Revenue. The Revenue has grown by 14.20% in the last year.
- Based on estimates for the next years, GVA will show a very strong growth in Earnings Per Share. The EPS will grow by 21.98% on average per year.
Every day, new Decent Value stocks can be found on ChartMill in our Decent Value screener.
Check the latest full fundamental report of GVA for a complete fundamental analysis.
Disclaimer
This article should in no way be interpreted as advice. The article is based on the observed metrics at the time of writing, but you should always make your own analysis and trade or invest at your own responsibility.