
Discover GRANITE CONSTRUCTION INC (NYSE:GVA)—an undervalued stock our stock screener has picked out. GVA demonstrates solid fundamentals, including health and profitability, all while staying attractively priced. Let's explore the details.
Looking at the Valuation
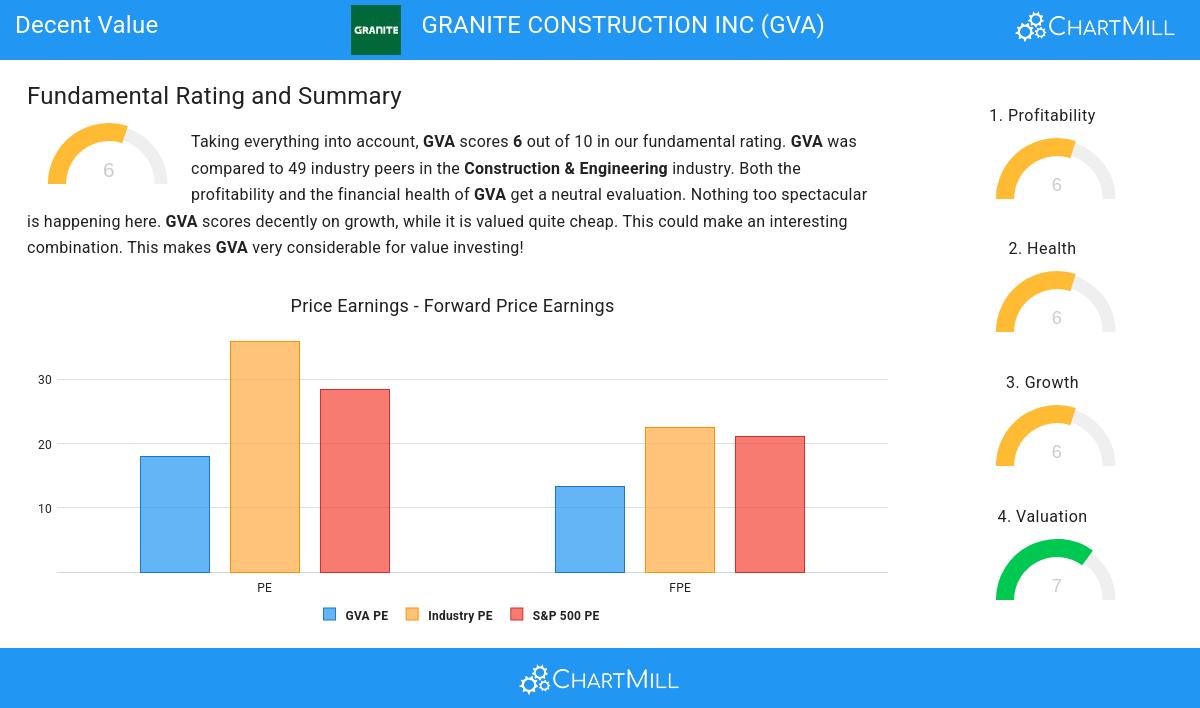
To assess a stock's valuation, ChartMill utilizes a Valuation Rating on a scale of 0 to 10. This comprehensive assessment considers various valuation aspects, comparing price to earnings and cash flows, while factoring in profitability and growth. GVA has achieved a 7 out of 10:
- 69.39% of the companies in the same industry are more expensive than GVA, based on the Price/Earnings ratio.
- When comparing the Price/Earnings ratio of GVA to the average of the S&P500 Index (28.38), we can say GVA is valued slightly cheaper.
- Based on the Price/Forward Earnings ratio, GVA is valued cheaper than 83.67% of the companies in the same industry.
- GVA's Price/Forward Earnings ratio indicates a valuation a bit cheaper than the S&P500 average which is at 21.15.
- Based on the Enterprise Value to EBITDA ratio, GVA is valued cheaply inside the industry as 83.67% of the companies are valued more expensively.
- Based on the Price/Free Cash Flow ratio, GVA is valued cheaply inside the industry as 81.63% of the companies are valued more expensively.
- The low PEG Ratio(NY), which compensates the Price/Earnings for growth, indicates a rather cheap valuation of the company.
- The decent profitability rating of GVA may justify a higher PE ratio.
- GVA's earnings are expected to grow with 21.98% in the coming years. This may justify a more expensive valuation.
Profitability Analysis for GVA
ChartMill assigns a Profitability Rating to every stock. This score ranges from 0 to 10 and evaluates the different profitability ratios and margins, both absolutely, but also relative to the industry peers. GVA scores a 6 out of 10:
- With a decent Return On Assets value of 4.18%, GVA is doing good in the industry, outperforming 61.22% of the companies in the same industry.
- GVA has a better Return On Equity (12.45%) than 61.22% of its industry peers.
- The last Return On Invested Capital (6.03%) for GVA is above the 3 year average (3.67%), which is a sign of increasing profitability.
- Looking at the Profit Margin, with a value of 3.15%, GVA is in the better half of the industry, outperforming 61.22% of the companies in the same industry.
- GVA's Profit Margin has improved in the last couple of years.
- GVA's Gross Margin has improved in the last couple of years.
Health Analysis for GVA
Every stock is evaluated by ChartMill, receiving a Health Rating on a scale of 0 to 10. This assessment considers different health aspects, including liquidity and solvency, both in absolute terms and relative to industry peers. GVA has achieved a 6 out of 10:
- GVA has an Altman-Z score of 3.03. This indicates that GVA is financially healthy and has little risk of bankruptcy at the moment.
- GVA has a debt to FCF ratio of 2.31. This is a good value and a sign of high solvency as GVA would need 2.31 years to pay back of all of its debts.
- The Debt to FCF ratio of GVA (2.31) is better than 69.39% of its industry peers.
- Although GVA does not score too well on debt/equity it has very limited outstanding debt, which is well covered by the FCF. We will not put too much weight on the debt/equity number as it may be because of low equity, which could be a consequence of a share buyback program for instance. This needs to be investigated.
- GVA has a Current ratio of 1.66. This is in the better half of the industry: GVA outperforms 73.47% of its industry peers.
- GVA's Quick ratio of 1.56 is fine compared to the rest of the industry. GVA outperforms 73.47% of its industry peers.
Understanding GVA's Growth
ChartMill assigns a Growth Rating to every stock. This score ranges from 0 to 10 and evaluates the different growth aspects like EPS and Revenue, both in the past as in the future. GVA scores a 6 out of 10:
- GVA shows a strong growth in Earnings Per Share. In the last year, the EPS has been growing by 29.07%, which is quite impressive.
- Measured over the past years, GVA shows a very strong growth in Earnings Per Share. The EPS has been growing by 32.75% on average per year.
- The Revenue has grown by 14.20% in the past year. This is quite good.
- Based on estimates for the next years, GVA will show a very strong growth in Earnings Per Share. The EPS will grow by 21.98% on average per year.
More Decent Value stocks can be found in our Decent Value screener.
For an up to date full fundamental analysis you can check the fundamental report of GVA
Keep in mind
This is not investing advice! The article highlights some of the observations at the time of writing, but you should always make your own analysis and invest based on your own insights.