
Technical investors often look for stocks showing both solid basic momentum and clear consolidation patterns that indicate possible breakouts. This method uses the ChartMill Technical Rating, which assesses general technical condition, with the Setup Quality Rating, which spots times of price consolidation that frequently come before notable moves. By filtering for stocks with high scores on both measures, traders can find securities with existing uptrends that are also forming narrow trading ranges, possibly presenting good risk-reward entry points.
Technical Strength Assessment
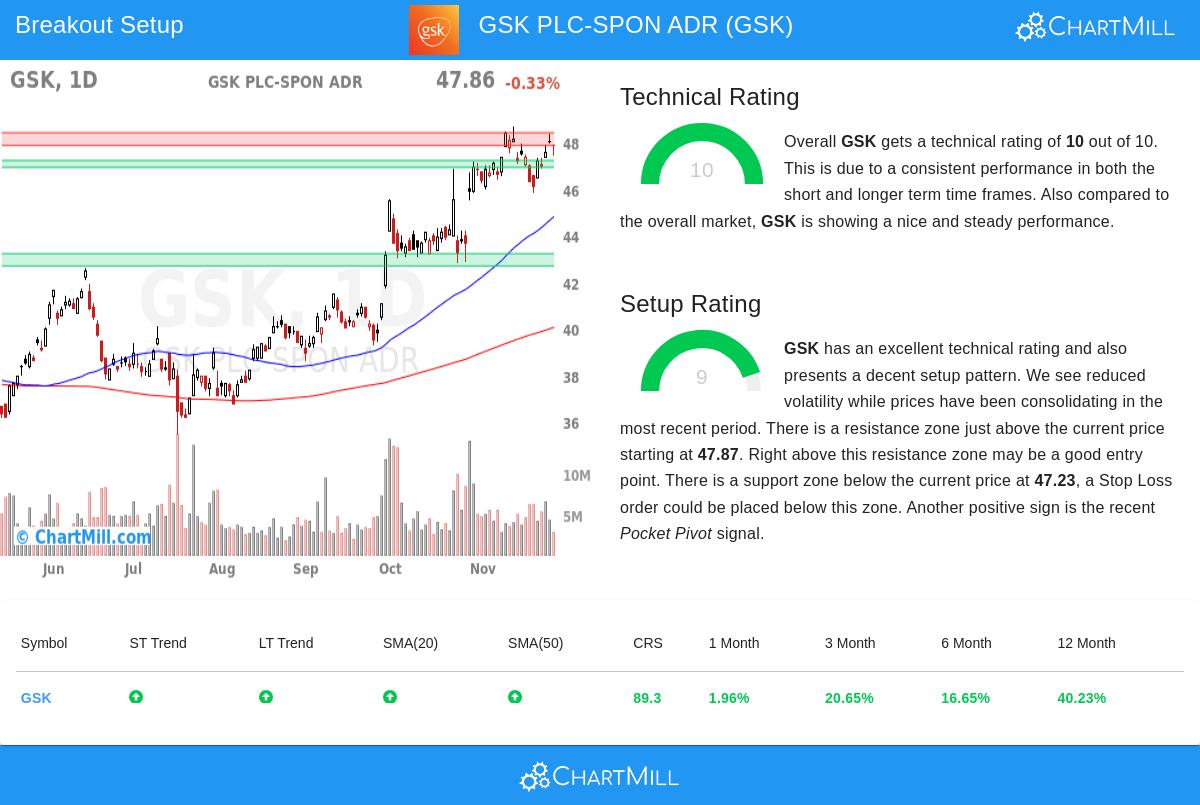
GSK PLC-SPON ADR (NYSE:GSK) shows very good technical features according to its ChartMill Technical Analysis report, getting a top rating of 10 out of 10. This highest score shows steady condition across various timeframes and technical indicators. The pharmaceutical company's stock displays solid momentum features that match what technical investors want in breakout possibilities.
Key technical positives include:
- Both long-term and short-term trends are clearly positive
- The stock performs better than 89% of all stocks on a yearly performance basis
- All main moving averages (20, 50, 100, and 200-day) are increasing and placed below the current price
- Relative strength is in the 89th percentile compared to the wider market
- Current trading near 52-week highs shows continued buyer interest
These technical features are important because stocks with high Technical Ratings usually keep their momentum longer, giving a good environment for breakout tries. The steady performance across different timeframes indicates institutional backing and lowers the chance of quick trend changes.
Setup Quality Analysis
Besides good technicals, GSK shows an interesting setup pattern with a Setup Quality Rating of 9 out of 10. The stock has been moving within a set range between $45.80 and $48.69 over the last month, with recent price action displaying lower volatility near the higher part of this range. This consolidation period creates the pressure that often comes before important directional moves.
Notable setup features:
- Prices have been consolidating lately within the wider monthly range
- A defined resistance area exists between $47.87 and $48.42
- Good support is formed between $46.93 and $47.23
- Recent pocket pivot signal shows institutional buying
- Lower volatility during consolidation indicates balance between buyers and sellers
The setup quality is important because it finds periods where risk can be clearly specified. The narrow consolidation allows for exact placement of stop-loss orders below support, while the nearness to resistance gives a clear breakout level that, if passed, could start more buying interest.
Trading Implications
For technical traders, the mix of GSK's top Technical Rating and high Setup Quality Rating forms an interesting situation. The stock's good basic trend provides the momentum base, while the present consolidation gives a possible entry chance with set risk limits. The automatically created trading setup indicates an entry above $48.43 (just above resistance) with a stop-loss below $46.92, making a managed risk situation of about 3.12%.
The existence of several support levels below the current price gives more confidence, as these levels could work as possible areas to reposition if the first breakout try does not work. The stock's high relative strength and sector outperformance further back the case for continued momentum after a successful breakout.
Technical investors searching for similar chances can use the Technical Breakout Setups screen to find other stocks displaying both good technical ratings and high-quality setup patterns in present market conditions.
Disclaimer: This analysis is based on technical indicators and pattern recognition and should not be considered as investment advice. Always conduct your own research and consider your risk tolerance before making any investment decisions. Technical analysis does not guarantee future performance and should be used as one tool within a complete investment method.