
For investors looking to join solid price momentum with basic growth in business fundamentals, a methodical plan can work well. One specific method is used by trader Mark Minervini. His plan joins a fixed technical checklist, the Trend Template, with a search for firms showing faster earnings and sales. The aim is to spot market leaders early in their large price gains by checking they are in strong upward trends and supported by sound company results. This two-step method tries to find stocks with a chance for major growth while controlling risk through strict rules for buying and selling.
GULFPORT ENERGY CORP (NYSE:GPOR) recently appeared from a scan made to locate stocks that meet both Minervini's technical needs and show traits of high-growth momentum. This mix indicates the stock may deserve more study from investors focused on growth.
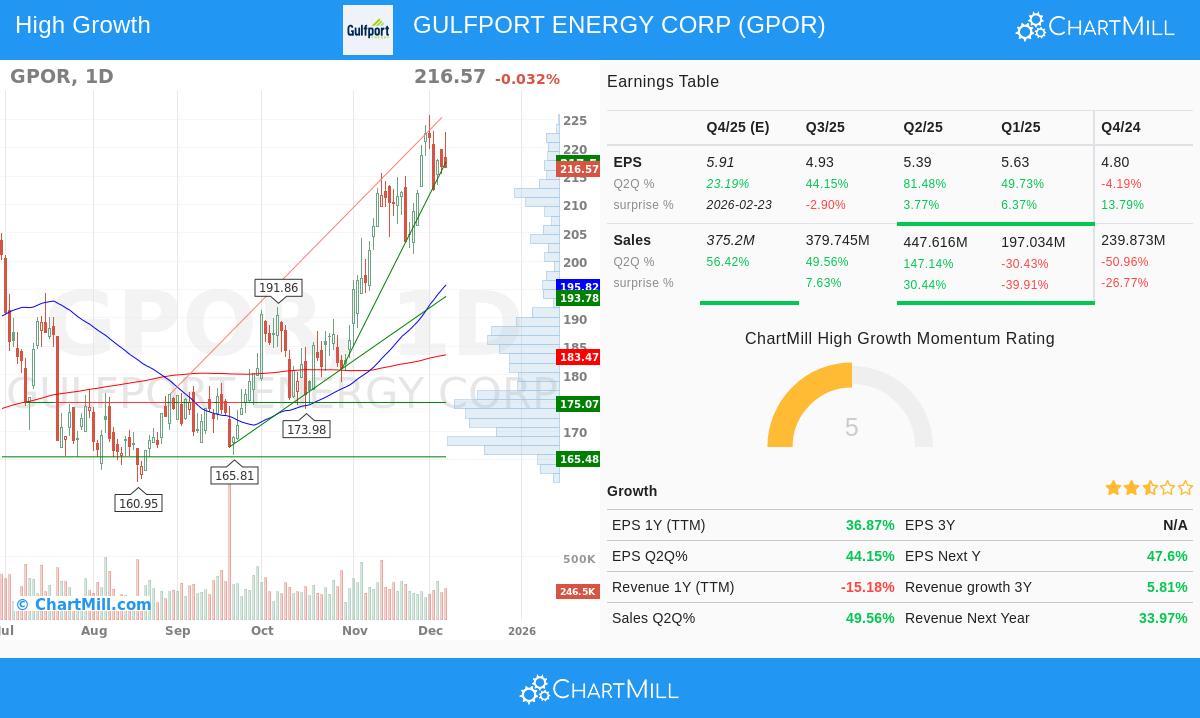
Fitting the Minervini Trend Template
Minervini's Trend Template is a basic technical filter made to sort for stocks in clear, strong upward trends. It focuses on price trading above important moving averages, good order of those averages, and nearness to new peaks. For a stock to pass, it must meet all conditions without fail, making sure only the most solid technical patterns are reviewed.
A check of Gulfport Energy's chart and main numbers shows it fits this strict template:
- Price Above Important Moving Averages: The stock's last price of $216.57 trades well above its rising 50-day ($195.82), 150-day ($186.65), and 200-day ($183.47) simple moving averages. This layered order is a standard sign of continued positive momentum across several time periods.
- Moving Average Order: The 50-day SMA is above both the 150-day and 200-day SMAs, and the 150-day SMA is above the 200-day SMA. This sequence verifies the short-term, medium-term, and long-term trends are all in good order.
- Nearness to Highs: The stock is trading within 4% of its 52-week high of $225.78, easily inside the template's need to be within 25% of the high. At the same time, its price is over 40% above its 52-week low, meeting the condition of being at least 30% above the low. This shows solid bounce momentum and a place of strength.
- Solid Relative Strength: With a ChartMill Relative Strength (CRS) score of 86.67, GPOR is doing better than about 87% of all stocks. High relative strength is a key part of the Minervini method, as it finds market leaders that are drawing money even during wider market gains.
This technical view meets the Minervini model, indicating GPOR is in a clear Stage 2 rise, the main phase where the plan aims to take part.
Business Fundamentals Backing High Growth Momentum
While the Trend Template handles the "when," Minervini's plan strongly stresses the "why" through study of business fundamentals. The linked scan also needed a high Growth Momentum (HGM) score, which measures the speed and quality of a company's earnings and sales growth. Gulfport Energy's recent financial numbers show several good growth signs.
- Earnings Growth Speed: The company displays notable quarterly earnings momentum. Its latest quarter reported year-over-year EPS growth of 44.2%, which increased from 49.7% growth two quarters before. Even more striking, the quarter before that showed very high growth of 81.5%. This sequence of solid, and in some times speeding, profit growth is a main feature looked for by growth investors.
- Positive Earnings Surprises: Over the past four quarters, GPOR has topped analyst EPS forecasts three times, with an average beat of 5.26%. Steady positive surprises can push upward estimate changes and fresh interest from large investors.
- Sound Profitability: The company keeps good profit margins. Its last reported quarterly profit margin was 21.4%, and it reported a large annual margin of 70% in its prior fiscal year. Solid margins offer protection during economic changes and are often a sign of efficient companies.
- Good Free Cash Flow: Creating plenty of cash is important for funding growth internally or giving capital back to shareholders. GPOR's trailing twelve-month free cash flow per share is $15.87, showing year-over-year growth of almost 49%.
These fundamental points, speeding earnings, steady beats, high profitability, and solid cash creation, provide the basic "drive" that can maintain a technical upward trend, building the argument for its high-growth momentum label.
Technical Condition and Pattern Summary
Beyond the core Trend Template, a close technical study gives more background for possible entry and risk control. According to ChartMill's own report, GPOR gets a high Technical Rating of 9 out of 10, showing very good overall technical condition with positive long-term and short-term trends.
The report also gives a Setup Rating of 8, meaning the stock is now in a period of sideways movement with lower price swings, which could be giving a possible entry chance. The study notes a bull flag pattern and a recent "Pocket Pivot" signal, a volume-based sign of big investor buying, both seen as good within momentum plans.
Key support and resistance levels are marked, with close resistance seen near $217.50 and support areas grouped below the present price, starting around $212.11. This setup allows for a clear measure of risk on any new position. For a full look at the technical picture, including exact trade setup ideas, readers can see the full technical analysis report for GPOR.
Locating Like Chances
Gulfport Energy Corp offers an example of a stock that now fits a strict growth and momentum plan by passing exact technical and fundamental filters. Investors wanting to search for like chances that meet the Minervini Trend Template and show high-growth momentum can examine the preset scan used in this study.
Find more possible choices by going to the High Growth Momentum + Trend Template screen on ChartMill.
Disclaimer: This article is for information and learning only. It is not advice to buy or sell any security. The study is based on given data and certain scanning methods. Investors should do their own complete research, think about their money situation, risk comfort, and investment goals, and talk with a qualified financial advisor before making any investment choices. Past results do not show future outcomes.