
For investors using a technical breakout strategy, the goal is to find stocks that are technically sound and ready for their next rise. This method often uses two main filters: a high technical rating, which shows the stock is in a good, steady uptrend, and a high setup quality rating, which shows the stock is resting in a tight range, possibly preparing for a clear move. Using these filters together, traders try to find chances in strong stocks at good entry points, just as they start to move from a quiet period.
GILEAD SCIENCES INC (NASDAQ:GILD) now shows a profile that fits this method well. The biopharmaceutical company, recognized for its work in virology and oncology, is displaying interesting technical traits that merit attention from investors focused on charts.
Technical Strength: A Base of Momentum
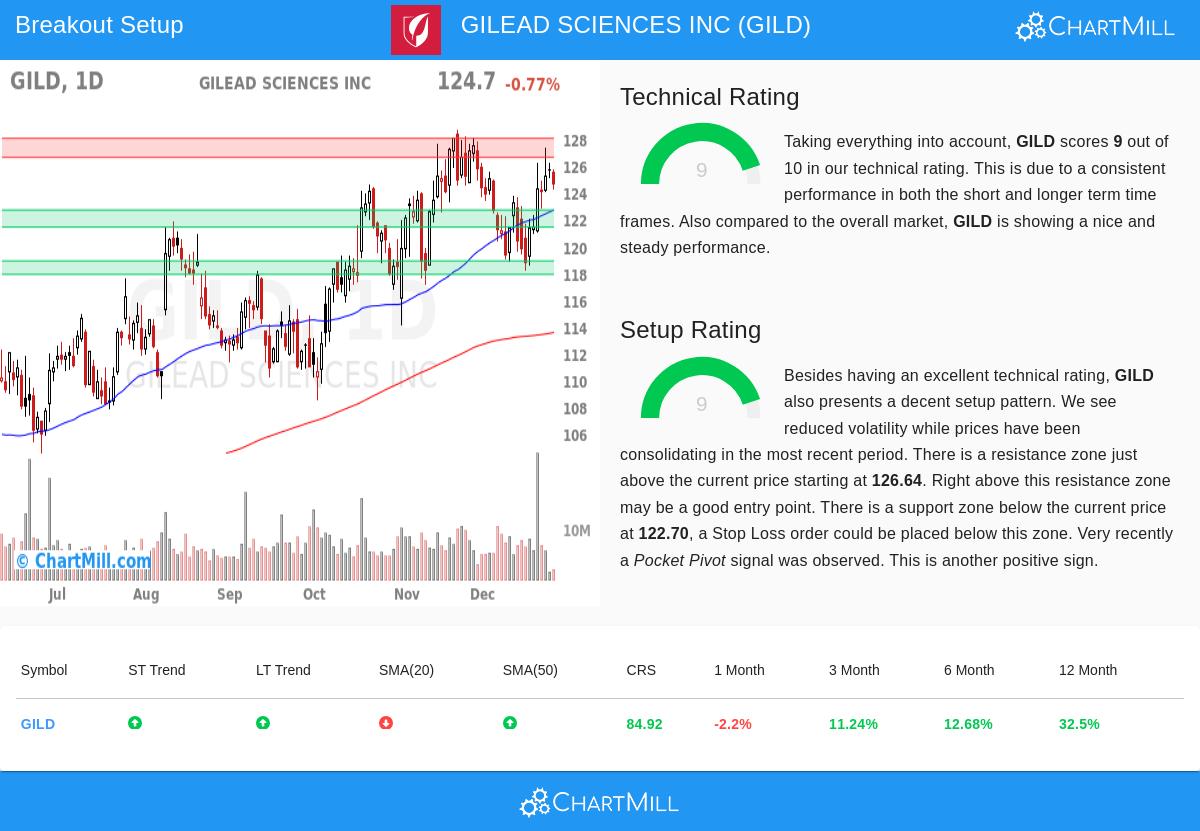
The center of any breakout strategy is a stock with good technicals, and Gilead Sciences does well here. Based on its ChartMill Technical Analysis report, the stock gets a Technical Rating of 9 out of 10. This number measures the general condition of the stock's trend by looking at different time periods and comparing its results to other stocks.
Main points adding to this good rating are:
- Positive Trend Agreement: Both the recent and longer-term trends for GILD are positive. This agreement across time periods is a solid sign of continued buying and lowers the chance of mixed signals.
- Good Relative Performance: In the last year, GILD has done better than 84% of all stocks. This better relative performance is a sign of market strength, a key feature for stocks in breakout strategies.
- Placement vs. Important Averages: The stock is priced above its main moving averages (20, 50, 100, and 200-day SMAs), which are all rising. This arrangement shows wide support and a positive price base.
This mix of a strong uptrend, good market performance, and supportive moving averages gives the basic "which stock" answer for technical investors. A high technical rating makes sure the existing momentum is positive before a trade is thought about.
Setup Quality: The Rest Before the Move
While technical strength finds a good candidate, the setup quality finds the "when" of a possible trade. GILD also does well here, with a Setup Rating of 9. This score judges the condition of the present price pattern, specifically looking for a resting period that might come before a breakout.
The present chart for GILD shows several signs of a good setup:
- Lower Volatility Resting Period: The report mentions "lower volatility while prices have been resting in the latest period." This tightening of price movement, often making a base or a small range, shows a balance between buyers and sellers and can come before a big move.
- Clear Support and Resistance: A defined support area is seen below the present price near $122.70, while a resistance area is just above, starting at $126.64. These clear levels are important for handling risk, as they give sensible places for stop-loss orders and breakout points.
- Recent Buying Signal: A "Pocket Pivot" signal was seen lately, which is a price and volume pattern indicating institutional buying. Such signals can add confidence to a forming setup.
For breakout traders, this high setup score is important. It suggests the stock is not stretched but is instead holding in a set range, giving a clear entry point above resistance and a sensible exit point below support.
A Possible Trade Plan
From this study, the technical report proposes a specific trading plan. The suggested setup uses an entry order just above the noted resistance at $128.08, with a stop-loss placed below the support area at $121.41. This plan sets the trade's risk early, about 5.2% on the share price, allowing for exact position sizing.
It is key to remember this is an example from the technical pattern. The real choice to make a trade, with the final entry, exit, and position size, must fit an individual's risk comfort and trading plan. Investors should always do their own research, especially about coming company events like earnings reports.
Finding Like Chances
Gilead Sciences shows the kind of chance the Technical Breakout Setups screen is made to find. For investors wanting to search the market for similar patterns in other strong stocks, new results from this screening method are ready each day. You can see the present list of possible breakout setups by going to the Technical Breakout Setups page.
Disclaimer: This article is for information only and is not investment advice, a suggestion, or an offer to buy or sell any securities. The study is from technical data and automated scoring models. All investing and trading has risk, including the possible loss of principal. Past results do not guarantee future results. Readers should do their own research and talk to a qualified financial advisor before making any investment choices.