
For investors using charts and price action to guide choices, the search for promising opportunities often involves finding stocks that are both technically sound and ready for a move. One way to simplify this search is by using a Technical Breakout screen, which filters for equities showing two key proprietary metrics: a high ChartMill Technical Rating, pointing to sound underlying trend condition, and a high ChartMill Setup Quality Rating, pointing to a consolidation pattern that might come before a new upward move. This method tries to find stocks where a solid trend is taking a short pause, possibly giving a good risk-reward entry point for the next breakout.
Gildan Activewear Inc (NYSE:GIL), a maker of basic apparel like activewear and underwear, is currently on such a scan. According to a recent technical analysis report, the stock shows a profile that matches the breakout strategy's main ideas, joining trend strength with a positive price pattern.
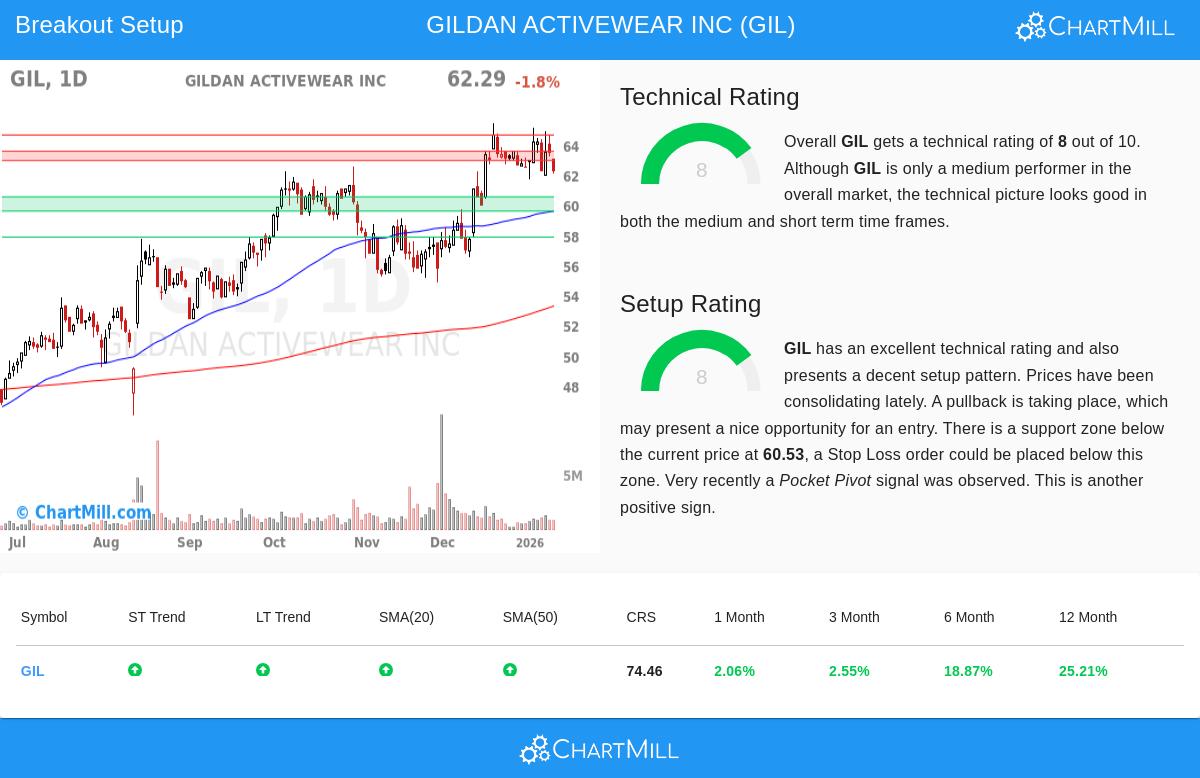
Looking at the Technical Strength
The base of a breakout setup is a stock already in a confirmed uptrend, which is exactly what the ChartMill Technical Rating of 8 out of 10 for GIL shows. This score measures the stock's overall technical condition, and a rating above 7 usually means a stock in a steady uptrend. The detailed technical report for GIL confirms this positive stance across several timeframes.
- Trend Agreement: Both the short-term and long-term trends for GIL are rated as positive. This agreement is a strong signal, meaning momentum is not just a temporary event but part of a bigger, confirmed upward move.
- Moving Average Backing: The stock is trading above all its main simple moving averages (20, 50, 100, and 200-day), and each of these averages is itself in a rising formation. This layered, rising support formation is a standard sign of a sound trend.
- Relative Performance: While the stock's one-year performance beats 74% of the market, its more recent six-month gain of almost 19% points to its current momentum. Also, it is in the top group of its Textiles, Apparel & Luxury Goods industry, doing better than 72% of similar companies.
This mix of factors supports the high Technical Rating. For the breakout method, this strength is essential; it gives the underlying condition for any possible move after a consolidation.
Looking at the Setup Quality
A sound trend alone is not a reason to buy; entering after a sharp, long run can be risky. This is where the Setup Quality Rating becomes important. It finds times of consolidation or tight trading ranges inside the uptrend, which can give lower-risk entry points. GIL's Setup Rating of 8 suggests it is in such a phase.
- Bull Flag Pattern: The technical report states that GIL is currently showing a bull flag pattern. This pattern forms when a stock has a strong vertical rise (the flagpole) followed by a small, downward-sloping consolidation (the flag). It is usually seen as a continuation pattern.
- Positive Pullback: The current pullback is happening on lower-than-average volume, which is normally seen as a good sign during consolidation. It means a lack of heavy selling, with holders staying relatively committed.
- Clear Support and Risk: The analysis finds a defined support area between $59.58 and $60.53, made by a combination of trendlines and moving averages. The existence of this nearby support allows for placing a sensible stop-loss order, which is needed for handling risk in any technical trade.
- Recent Accumulation Signal: An extra positive point is the recent "Pocket Pivot" signal noted in the report, a pattern that means accumulation by larger participants during the consolidation, often coming before a breakout.
The high Setup Rating confirms that GIL's recent price action is not disorderly but shows a controlled pause. This creates the possible "setup" the strategy looks for, a moment where the solid trend found by the Technical Rating is pausing before possibly continuing.
A Possible Trading Situation
Based on this technical formation, the analysis proposes a specific situation. Resistance is noted near the $63.57 level. A breakout above this area could signal the end of the consolidation and the start of the next upward move. On the other hand, a break below the identified support near $60.53 would break the bull flag pattern and mean a deeper pullback might be happening. This clear separation between breakout and failure levels is what makes such setups usable for technical investors.
Finding Like Opportunities
Gildan Activewear acts as a current example of how joining trend and pattern analysis can identify possible opportunities. Investors wanting to see other stocks that currently fit similar conditions for technical strength and setup quality can view the live results of the Technical Breakout screen here.
Disclaimer: This article is for information only and is based on a technical analysis method. It is not investment advice, a suggestion to buy or sell any security, or a promise of future results. The noted trade situation is automatically made for example. Investors should do their own research, think about their personal risk tolerance, and know about upcoming company events like earnings reports before making any investment choices.