
For technical investors aiming to use momentum, a common method involves finding stocks that are both technically sound and forming a consolidation pattern, set for a possible breakout. This method tries to enter a stock as it continues an existing uptrend after a pause, providing a good balance of risk and reward. One way to find these chances is by using a screen that looks for stocks with a high ChartMill Technical Rating, showing sound basic trend condition, and a high ChartMill Setup Quality Rating, indicating a constructive price consolidation. Gildan Activewear Inc (NYSE:GIL) recently appeared from such a scan, presenting a profile that needs a more detailed examination from a technical viewpoint.
Technical Strength: A Sound Base
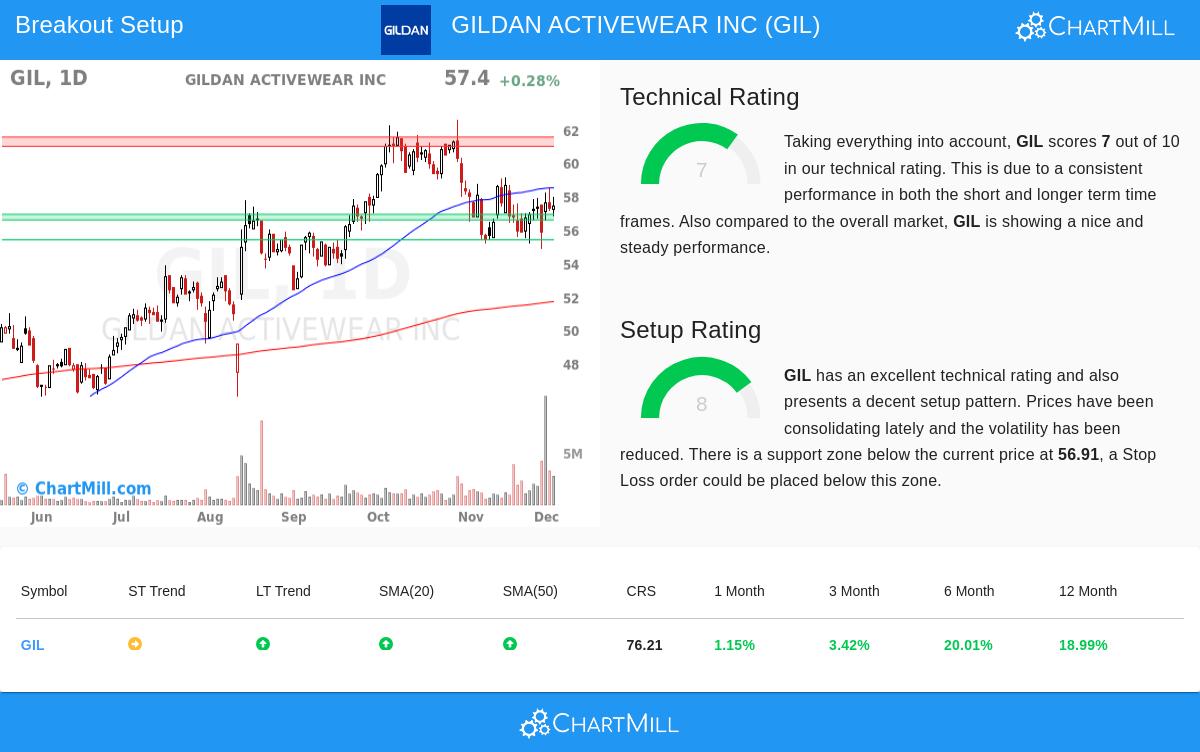
The base of any breakout trade is the basic trend. A stock needs to show continued strength to raise the chance that a breakout will lead to a continuation of the uptrend instead of a false signal. Gildan Activewear receives a ChartMill Technical Rating of 7, which classifies it as a stock in a sound uptrend. This rating is a combined score that reviews multiple timeframes and technical items.
A closer look at the technical analysis report shows the items supporting this rating:
- Long-Term Trend: The long-term trend is viewed as positive, a vital part for a breakout method as it aligns the trade with the main market direction.
- Relative Strength: The stock's performance over the last year places it ahead of 76% of all other stocks and does better than 71% of its peers in the Textiles, Apparel & Luxury Goods industry. This relative outperformance is a main sign of institutional interest and leadership.
- Moving Average Alignment: The stock is trading above all its main simple moving averages (20, 50, 100, and 200-day), and each of these averages is rising. This stacked, bullish alignment of moving averages is a standard sign of a healthy, trending stock.
This mix of items gives the "which stock" answer for technical investors. The sound technical rating indicates GIL has the basic momentum needed to maintain a move higher if a breakout happens.
Setup Quality: The Pattern of Chance
While a strong trend is needed, it is not enough for a best entry. Buying a stock that has already made a sharp, extended move higher holds notable risk of an immediate pullback. The best situation is to find a strong stock that is taking a pause, letting volatility decrease and building energy for its next step up. This is where the Setup Quality Rating becomes very useful.
Gildan Activewear has a Setup Rating of 8, showing a high-quality consolidation pattern. The report points out several traits that add to this score:
- Consolidation in a Range: Over the last month, GIL has traded between $54.83 and $59.09. It is now trading in the middle of this range, which the report states "may present a good entry chance." This time of sideways action after an advance lets the stock absorb its gains.
- Clear Support Zone: A well-defined support zone is found between $56.57 and $56.91, formed by a combination of trendlines and moving averages. For a breakout trader, a nearby support level is vital as it gives a logical and close level to place a protective stop-loss order, clearly stating the trade's risk.
- Lower Volatility: The setup summary states "lower volatility while prices have been consolidating," which is a common trait of a coiling pattern that often comes before a notable price movement.
This setup directly answers the "when to buy" question. The consolidation offers a possible entry point, the support zone states risk, and the lower volatility suggests the stock may be getting ready for its next directional move.
Trade Structure and Market Setting
Based on this review, the technical report suggests a possible trading setup with an entry at $58.50 (a buy-stop order placed above recent consolidation highs) and an exit stop-loss at $56.56 (placed just below the found support zone). This structure would limit the theoretical risk on the trade to about 3.3%.
It is important to note that while GIL shows strong individual traits, the report states it is slightly behind the wider S&P 500 index, which is trading near new highs. This could be seen as the stock having catch-up possibility if the overall market trend stays positive, which it now is according to both short and long-term reviews.
Finding More Possible Breakouts
The process that found Gildan Activewear can be used regularly to find new chances daily. By concentrating on stocks that at the same time show high technical and setup ratings, investors can effectively scan for candidates that are both trending and set for a move.
For investors wanting to see the current list of stocks meeting these technical breakout requirements, the live screen is available here.
Disclaimer: This article is for informational purposes only and does not constitute investment advice, a recommendation, or an offer or solicitation to buy or sell any securities. The trading setup mentioned is an automatically generated example for illustrative purposes and is not a recommendation. All investing and trading involves risk, including the potential loss of principal. Always conduct your own due diligence, consider your personal financial situation and risk tolerance, and consult with a qualified financial advisor before making any investment decisions.