
Graham Corp (NYSE:GHM) has become a possible choice for investors using Mark Minervini’s high-growth momentum strategy. This method blends strict technical screening, using Minervini’s Trend Template, with fundamental growth measures to find stocks showing strong upward movement and faster earnings. The strategy focuses on stocks in Stage 2 uptrends, backed by better fundamentals, to benefit from continued price gains.
Why GHM Matches the Minervini Trend Template
Minervini’s Trend Template demands stocks meet exact technical rules to confirm a solid uptrend. GHM meets these requirements:
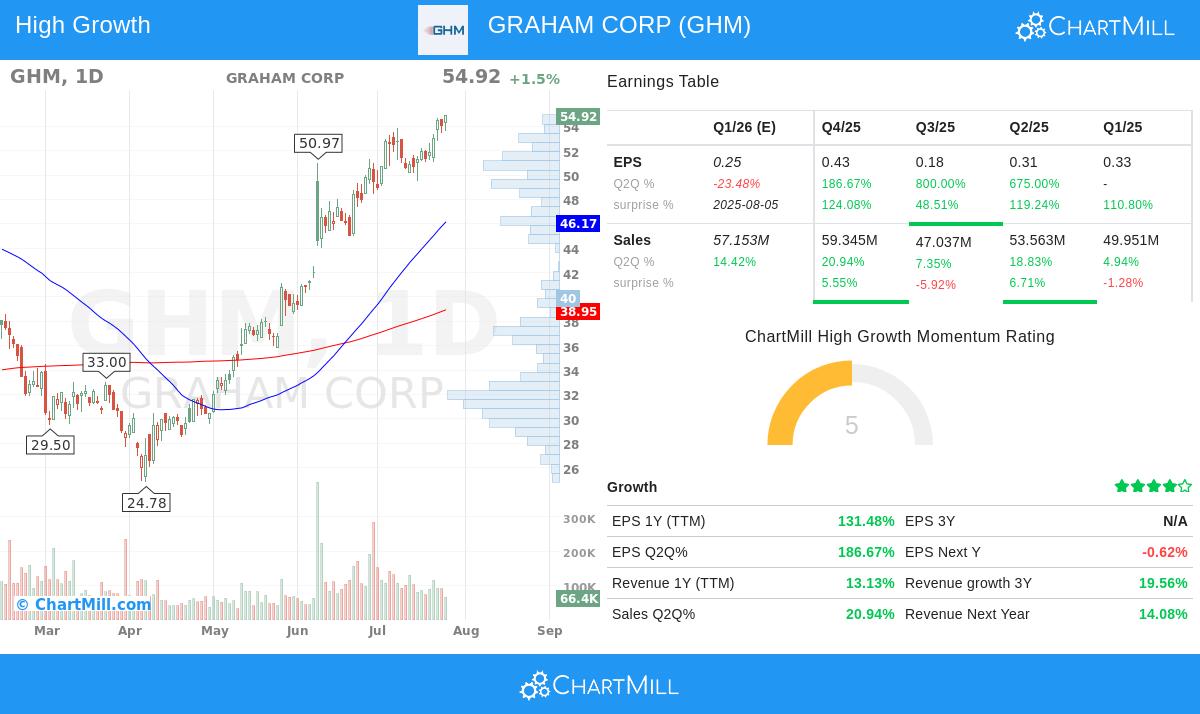
- Price Above Key Moving Averages: The stock trades at $54.92, above its 50-day ($46.17), 150-day ($39.62), and 200-day SMA ($38.95). This confirms bullish trends in both short and long terms.
- Rising Moving Averages: The 50-day, 150-day, and 200-day SMAs are all moving up, showing continued momentum.
- Price Compared to 52-Week Range: GHM is trading near its 52-week high ($54.93) and 122% above its 52-week low ($24.78), reflecting strong investor trust.
- Relative Strength: With a ChartMill Relative Strength (CRS) score of 94.54, GHM beats 94% of all stocks, a key feature of top performers.
These points match Minervini’s focus on stocks with clear technical strength, lowering the chance of entering fading trends.
High Growth Momentum Fundamentals
Beyond technicals, GHM shows faster growth, a key part of Minervini’s high-growth momentum strategy:
- Earnings Growth:
- EPS grew 131.5% year-over-year (TTM), with recent quarterly EPS jumping 186.7% (Q2Q).
- The company has exceeded EPS estimates in all of the last four quarters, with an average surprise of 100.7%.
- Revenue Growth:
- Revenue rose 13.1% year-over-year (TTM), with the latest quarter up 20.9%.
- Analysts have increased next-year revenue estimates by 4.3% over the past three months, showing confidence.
- Profit Margin Improvement:
- Quarterly profit margins went from 3.4% to 7.4% in the most recent quarter, pointing to better efficiency.
These numbers suggest GHM is not only technically strong but also backed by better profitability and revenue—key factors for lasting price gains.
Technical Analysis Summary
ChartMill’s technical report gives GHM a top rating of 10/10, noting:
- A solid uptrend across all timeframes.
- Better performance than 94% of stocks and 90% of its Machinery industry peers.
- Recent 52-week highs, supporting bullish momentum.
However, the setup quality score of 6/10 hints at waiting for a consolidation phase to improve entry timing. The stock’s recent swings may offer a better risk/reward chance after a pullback.
Full Technical Analysis Report Here
Conclusion
GHM fits both Minervini’s Trend Template and high-growth momentum investing, combining technical strength and faster fundamental growth. While the stock’s recent rally suggests careful entry timing, its growth path and relative strength make it a stock worth watching.
For more high-growth momentum stocks filtered by Minervini’s rules, check our High Growth Momentum + Trend Template Screen.
Disclaimer: This analysis is for informational purposes only and does not constitute investment advice. Always conduct your own research or consult a financial advisor before making investment decisions.