
In the field of growth investing, joining a solid technical system with firm fundamental momentum can be an effective way to spot possible leaders. One organized technique for this is the Mark Minervini plan, which brings together his specific Trend Template with an emphasis on high-growth fundamentals. The Trend Template gives a precise technical list to confirm a stock is in a definite, strong uptrend, while a high growth momentum (HGM) score aids in finding companies showing faster earnings and sales, the basic force that frequently supports continued price gains. This two-part method aims to locate stocks that are both technically sound and supported by better business results.
Gold Fields Ltd. (GFI) (NYSE:GFI) offers a notable example for this joined method. As a global gold mining company with activities in South Africa, Australia, Ghana, and Peru, its recent results indicate it may fit the standards looked for by growth-focused investors using the Minervini plan.
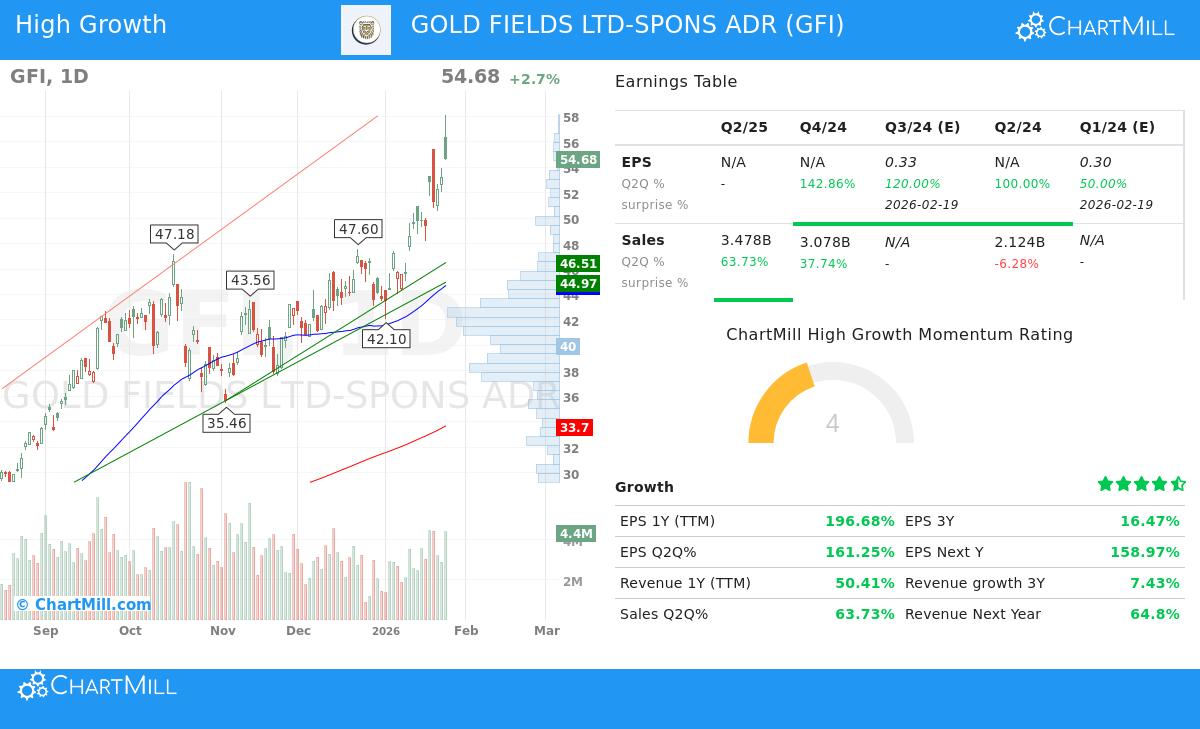
Fitting the Minervini Trend Template
The center of Minervini's technical plan is his Trend Template, a group of fixed rules made to sort for stocks in a clear Stage 2 uptrend. GFI's present chart shows a clear fit with these standards:
- Price Above Key Moving Averages: The stock's last price of $54.68 trades well above its rising 50-day ($44.71), 150-day ($37.24), and 200-day ($33.70) simple moving averages (SMAs). This order of positive arrangement is a main part of the template, showing continued buying interest across all periods.
- Moving Average Arrangement: The shorter 50-day SMA is placed above both the 150-day and 200-day SMAs, while the 150-day SMA also trades above the 200-day SMA. This step-by-step positive arrangement confirms the trend's force and gaining speed.
- Nearness to Highs: A main Minervini rule is to concentrate on force, not low price. GFI's price is within 6% of its 52-week high of $58.09, showing it is a market frontrunner, not a follower. At the same time, it sits over 217% above its 52-week low, confirming a strong recovery and uptrend are already in place.
- Better Relative Strength: With a ChartMill Relative Strength (CRS) score of 97.78, GFI is doing better than nearly 98% of the whole market. Minervini notes that the largest gainers usually show high relative strength early in their advances, as it points to institutional buying and leadership.
This technical view is not by chance; it shows the basic fundamental story that has gained the market's notice.
The High-Growth Fundamental Driver
The Minervini plan suggests that the largest stock advances are supported by strong fundamental gains. GFI's recent financial numbers show a time of notable operational and financial results that support its technical rise.
- Fast Earnings Growth: The company's trailing twelve-month (TTM) EPS has increased by a large 197% year-over-year. Even more notable is the recent quarterly gain, with the last reported quarter showing EPS growth of 161% compared to the same quarter last year. This type of sharp earnings rise is exactly what Minervini's "SEPA" (Specific Entry Point Analysis) method looks for, as it draws major institutional investment.
- Solid Revenue Growth: Top-line growth is also firm, with TTM revenue up over 50% and the latest quarterly sales increasing by nearly 64%. This shows the earnings growth is pushed by greater scale, not only lower costs.
- Gaining Profitability: The company's profit margin in the last reported quarter was about 29.5%, a clear gain from the 23.9% reported in the last full fiscal year. Rising margins along with fast sales is a clear sign of a high-quality growth story and adds directly to the "large earnings" that Minervini says "draw big notice."
- Positive Analyst Changes: Adding more confidence, analysts have been increasing their estimates. The average EPS estimate for the next fiscal year has been adjusted upward by over 7% in the last three months. Upward changes often come before continued stock price force as they show better forward view and feeling.
Technical Condition and Present Position
A look at the ChartMill Technical Report for GFI gives a measured summary of its market stance. The stock gets a complete technical score of 10 out of 10, showing its strong long-term and short-term positive trends, better relative strength, and place as a market frontrunner. The report states GFI is doing better than 97% of all stocks and 71% of its group in the Metals & Mining industry.
However, the report also gives an important note for possible investors: while the technical condition is very good, the present Setup Quality score is low (3 out of 10). This shows the stock has been in a firm, changing upward move and is not now in a close, low-change consolidation shape. In Minervini's words, it may not be giving a perfect, low-risk "pivot point" or Volatility Contraction Pattern (VCP) entry at this exact time. The study indicates it could be wise to wait for a time of consolidation to form a clearer support level before starting a new position.
You can see the full, complete technical study here: ChartMill Technical Report for GFI.
A Subject for More Study
Gold Fields Ltd. acts as a relevant example of a security that fits the ideas of high-growth momentum investing inside a firm technical trend. It satisfies the strict list of the Minervini Trend Template, showing clear market leadership and a strong uptrend. Basically, it is backed by a time of fast earnings and sales growth along with gaining profitability, main forces that can support a major price increase.
For investors looking to find other securities that match this "High Growth Momentum + Trend Template" form, the screen used to find GFI can be a useful beginning for more study.
Find more possible subjects using the same screening method here: High Growth Momentum + Trend Template Screen.
Disclaimer: This article is for information and learning only. It is not a suggestion to buy or sell any security. The study is based on present data and a specific investment method, but past results are not a guide for future results. All investing has risk, including the chance of loss of original funds. You should do your own study and talk with a qualified financial advisor before making any investment choices.